Chainlink Nears $13.50 Breakout as LINK ETF Inflows Reach Yearly High
Key Takeaways
- •LINK-focused exchange-traded funds attracted $9.48 million in net inflows on Friday, their largest single-day intake so far this year, according to SoSoValue data.
- •LINK ETFs have recorded five consecutive weeks of inflows, pointing to sustained demand for the token through traditional investment vehicles.
- •Wallets holding between 1 million and 100 million LINK now control 65.6% of circulating supply, up 0.22 percentage points from October 1, according to Santiment.
- •On the charts, LINK faces descending resistance near $13.50, with a confirmed breakout potentially opening the way to $13.93, the $15.77 swing high, and a 127.2% Fibonacci extension near $16.77.
- •Momentum has strengthened on the four-hour chart, with the RSI near 55 and the MACD in positive territory, though price must clear $13.50 to confirm a breakout.
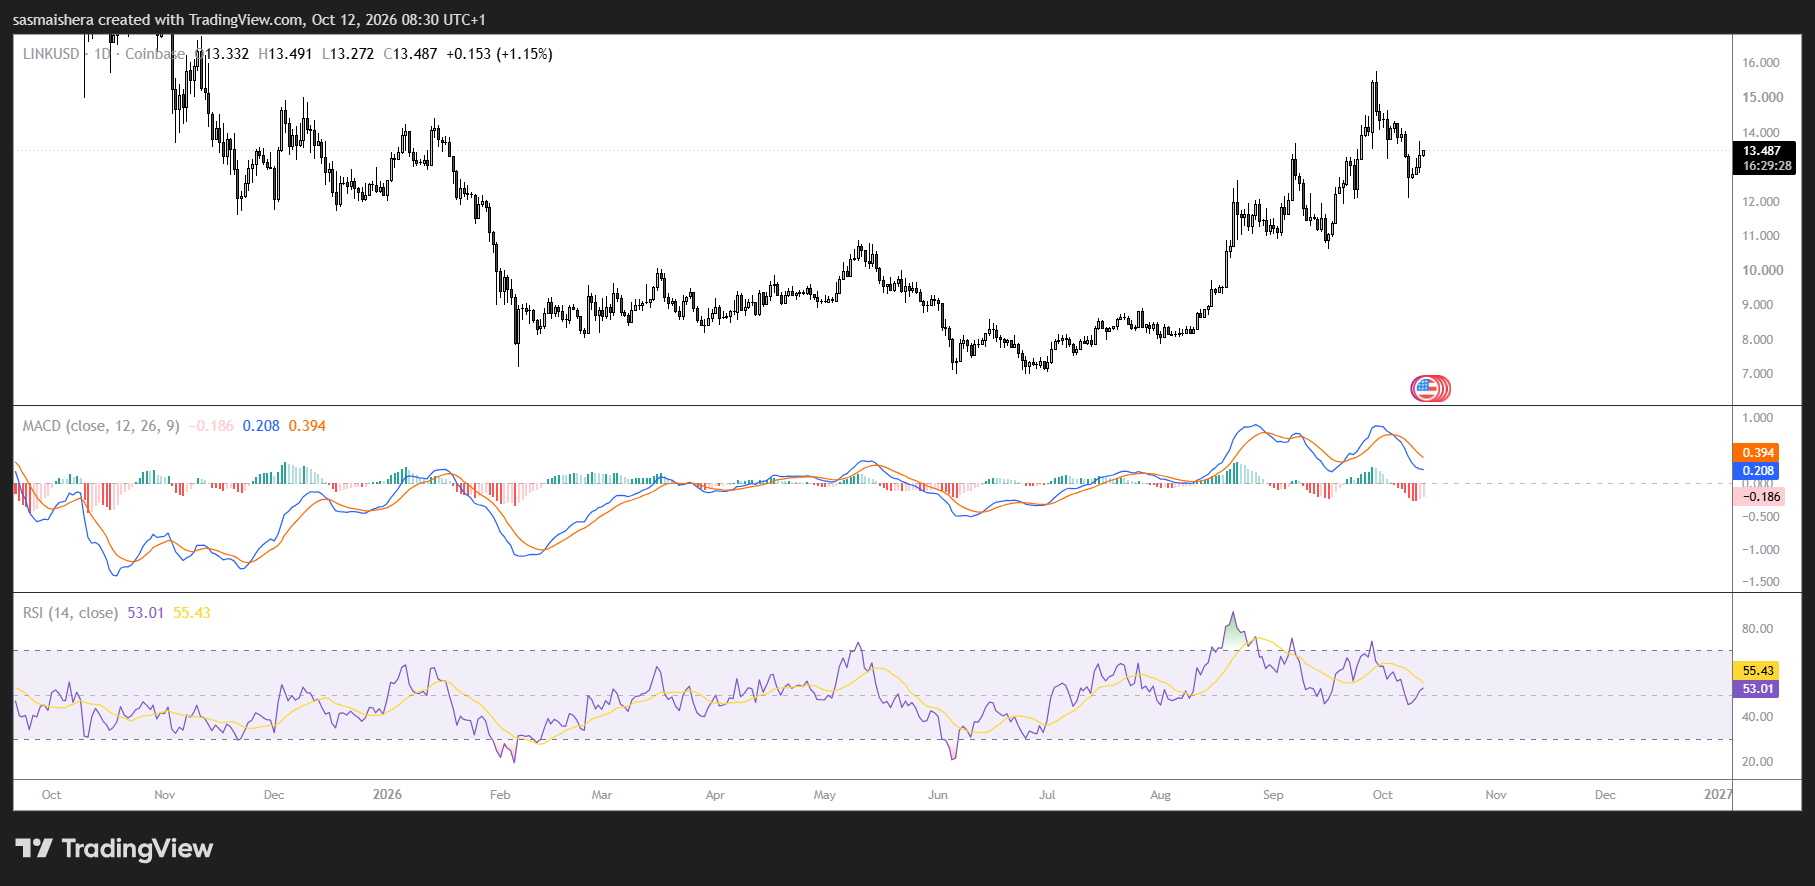
Chainlink (LINK), a decentralized oracle network that connects blockchains with off-chain data, held above the $13 mark on Monday, trading near $13.34 as it extended its recovery from last week's pullback to a low of $12.09 on Thursday. The rebound has been underpinned by the strongest exchange-traded fund inflows of the year and a growing share of supply held in large wallets, with buyers now testing resistance around $13.50.
LINK ETFs Post Largest Daily Inflow of the Year
LINK-focused exchange-traded funds attracted $9.48 million in net inflows on Friday, their largest single-day intake so far this year, according to data from SoSoValue. Spot ETFs hold the underlying token and trade on conventional exchanges, offering exposure through standard brokerage accounts rather than crypto-native platforms — part of the broader wave of US-listed crypto spot funds that began with bitcoin and ether.
The products have now recorded five consecutive weeks of inflows, a pattern that points to sustained demand for LINK exposure through traditional investment vehicles. That buying has provided a supportive backdrop for the token's rebound, though continued inflows are likely to be important if the recovery is to push beyond nearby resistance.
Large Wallets Expand Share of Circulating Supply
Data from Santiment shows that wallets holding between 1 million and 100 million LINK now control 65.6% of the token's circulating supply, up from 65.38% on October 1 — an increase of 0.22 percentage points. The rise suggests growing exposure among large-wallet holders. Such concentration metrics are followed because decisions by the largest holders can have an outsized effect on available liquidity.
The figure comes with a caveat: wallet-size categories can include exchanges and other entities, so the balance changes do not necessarily reflect individual investors alone. Combined with the positive ETF flows, the data points to stronger demand as LINK attempts to reverse its recent correction.
Technical Picture Hinges on $13.50 Trendline
Chainlink's broader structure remains supported by an ascending trendline connecting the August 10 and September 16 lows near $12.30. Even so, the token is still recovering from the downswing that began at the September 29 high of roughly $15.77.
On the four-hour chart, LINK sits just above its declining 50-period exponential moving average near $13.32. The next obstacle is a descending resistance trendline around $13.50, drawn from the September 30 and October 5 highs.
A confirmed move above that barrier would bring $13.93 into view — the 50% Fibonacci retracement of the decline from $15.77 to $12.09. A sustained advance beyond it would put the $15.77 swing high back in focus, followed by the127.2% Fibonacci extension near $16.77.
Momentum indicators have strengthened: the four-hour Relative Strength Index, a momentum gauge scaled from 0 to 100, stands near 55, above its neutral midpoint, while the Moving Average Convergence Divergence indicator, which tracks trend momentum through moving-average relationships, has moved into positive territory. Both readings point to building upside momentum on the shorter timeframe, although price still needs to clear the $13.50 resistance to confirm a breakout.
On the downside, the 50-period EMA at $13.32 marks the nearest support reference, followed by the 200-period EMA at $12.95. A deeper pullback would expose the ascending trendline near $12.30 and Thursday's $12.09 low. Holding those levels would help preserve the recovery structure if the initial breakout attempt fails. Beyond the charts, weekly ETF flow updates and shifts in whale-held supply will provide further checkpoints on whether the demand behind the rebound persists.

