Chainlink Breaks Out 6% but Faces Critical Resistance at $8.83–$8.94
Key Takeaways
- •Standard Chartered projected LINK at $13 by the end of 2026 and $200 by 2030, but the market reaction was initially muted.
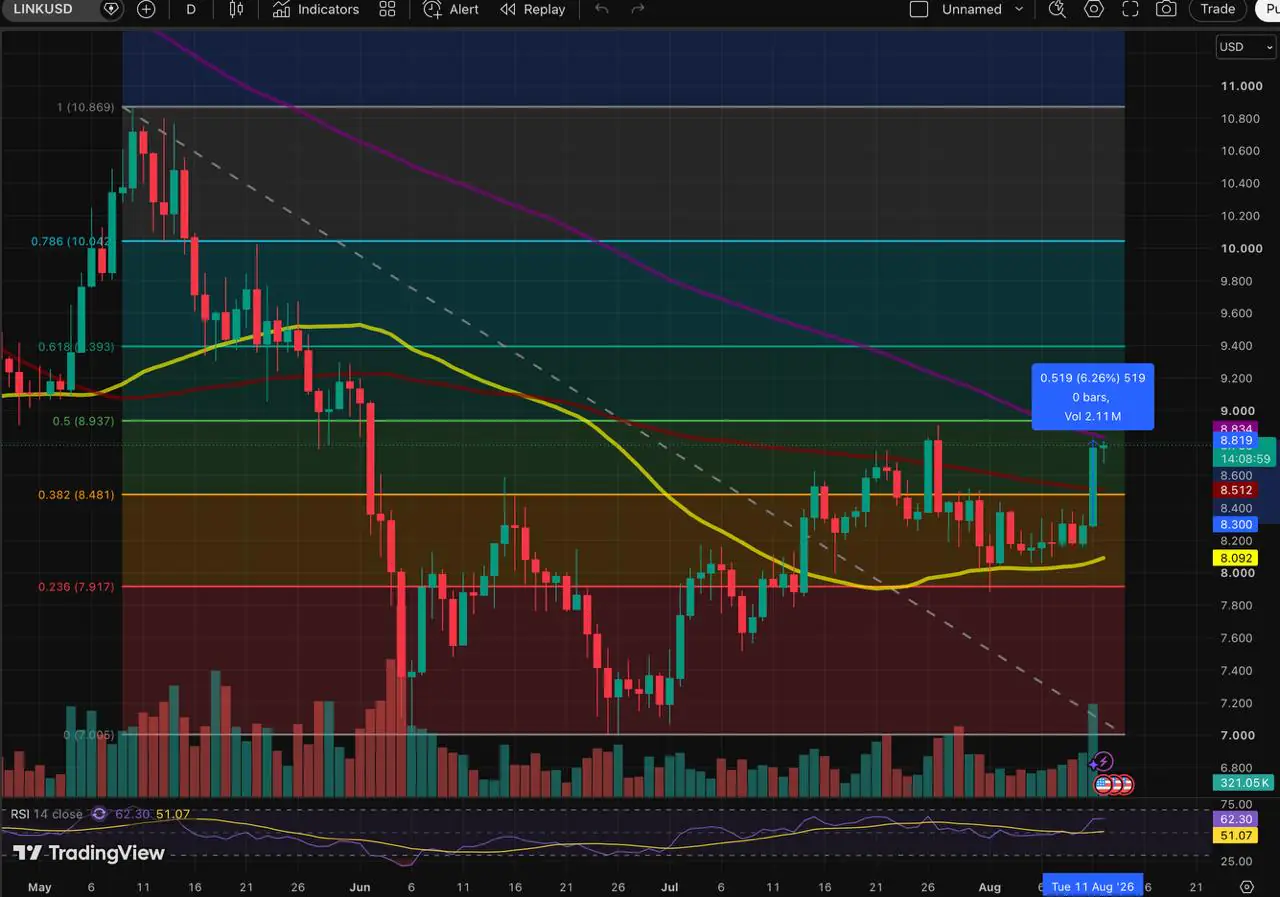
- •LINK later gained about 6.2% and moved above the 0.382 Fibonacci level and the 100-day simple moving average.
- •As of August 12, LINK was trading around $8.82, just below the 200-day simple moving average at $8.83.
- •The next major resistance zone is $8.83–$8.94, and a move above it would expose the $9.39 Fibonacci level.
- •Santiment recorded 246 LINK transactions of at least $100,000 in 24 hours, the highest daily count in five months, alongside rising balances among large holders.
Chainlink's LINK token broke out of its late-July trading range on August 11 with a roughly 6.2% gain, only to immediately confront a denser cluster of long-term resistance levels that will determine whether the move has staying power. Chainlink operates as a decentralized oracle network that supplies smart contracts with real-world data feeds, and LINK—used to compensate node operators—has long been one of the most closely watched infrastructure assets in crypto, particularly as the project has expanded into cross-chain interoperability through its CCIP protocol.
Delayed Reaction to Standard Chartered's Outlook
On August 10, Standard Chartered released a bullish long-term price forecast for LINK, projecting the token to reach $13 by the end of 2026 and $200 by 2030. The bank has been progressively expanding its digital assets research coverage, and the LINK call followed similar long-term projections for other major tokens. The market barely responded—LINK held within a narrow $8.22–$8.26 band, with buyers unable to push through a technical ceiling that had contained price action since late July.
That ceiling was defined by two converging indicators: the 100-day simple moving average and the 0.382 Fibonacci retracement level. LINK needed to clear both to break free from the range, as noted in prior analysis.
The breakout materialized a day later. LINK surged approximately 6.2%, pushing above the 0.382 Fibonacci level at $8.48 and the 100-day SMA near $8.50 before advancing toward the 200-day SMA. As of August 12, LINK was trading around $8.82 on Coinbase, just beneath the 200-day average at $8.83.
A Tight Resistance Cluster Looms
The 200-day SMA represents only the lower boundary of the next significant resistance zone. The 0.5 Fibonacci retracement level sits at $8.94, forming a compressed $8.83–$8.94 resistance band that also coincides with the price region from which LINK's broader downtrend originated in June.
A momentary push above the 200-day average would not constitute a meaningful breakout on its own. LINK must clear the entire zone and establish support above it, rather than piercing the moving average only to stall at the Fibonacci level.
Technical indicators show daily RSI at 62.30—above the neutral 50 threshold but still below the conventional overbought reading of 70. The August 11 candle also exhibited a noticeable increase in trading volume compared to the extended consolidation period that preceded it.
Should LINK confirm a move above $8.94, the 0.618 Fibonacci retracement near $9.39 would emerge as the next visible resistance target. Conversely, a rejection from the $8.83–$8.94 zone would refocus attention on the $8.48–$8.50 region, where the 0.382 Fibonacci level and 100-day SMA converge. Holding that former resistance on a pullback would preserve the breakout structure; losing it would return LINK to its prior range.
Whale Activity Reaches Five-Month High
On-chain data from Santiment recorded 246 LINK transactions valued at $100,000 or more within a 24-hour window—the highest daily count in five months.
Wallets holding between 100,000 and 10 million LINK collectively controlled 466.3 million tokens, equivalent to 46.5% of the total supply. Santiment reported balance growth within this cohort as large-transaction activity reached its five-month peak.
While the surge in large transactions is not inherently directional, the concurrent rise in wallet balances suggests that major holders were accumulating rather than merely repositioning assets. The timing is notable: LINK broke out of its late-July range precisely as large-holder activity and balances strengthened, providing the August 11 move with deeper support than price action alone would indicate.
The on-chain signal now converges with a critical technical test at $8.83–$8.94. Clearing that zone would align whale accumulation with confirmation of a broader breakout, while another rejection would demonstrate that elevated positioning has not yet sufficed to carry LINK through long-term resistance.

