Celestia (TIA) Price Analysis and Forecast 2026–2032: Technical Outlook and Historical Price Trends
Key Takeaways
- •TIA is trading at approximately $0.31 as of July 29, having declined over 4% in the past 24 hours amid sustained bearish pressure.
- •Celestia successfully completed its v9.0.4 network upgrade on July 1, with exchanges temporarily pausing deposits and withdrawals while trading continued uninterrupted.
- •TIA reached its all-time high of $15.14 on December 24, 2023, but has experienced a significant and prolonged downtrend since early 2024.
- •Price forecasts project TIA to reach an average trading price of $1.3 in 2026, with longer-term estimates suggesting an average of $7.41 by 2032.
- •Celestia secured venture funding from firms including Bain Capital Crypto and Polychain Capital ahead of its mainnet debut, supporting its modular blockchain data availability infrastructure.
Celestia (TIA) drew considerable attention ahead of its October 2023 launch, supported by backing from major cryptocurrency exchanges and the modular blockchain architecture that distinguishes the Celestia network within the broader crypto landscape. As a dedicated data availability layer, Celestia allows rollups and other chains to publish transaction data without maintaining their own consensus or settlement layers, separating data availability from execution in a design that has become central to the modular blockchain thesis. The TIA token serves multiple roles within this ecosystem, including staking for network security, payment for data availability services, and governance. This article examines TIA's current technical setup, near-term price action, annual forecasts through 2032, and the token's historical price trajectory.
TIA Technical Analysis: Bearish Pressure Toward $0.31
As of July 29, TIA is experiencing bearish volatility near the $0.31 level. Sellers remain in control of the price chart, pushing the token toward support channels.
- Resistance: $0.3566
- Support: $0.2787
Daily Chart Analysis
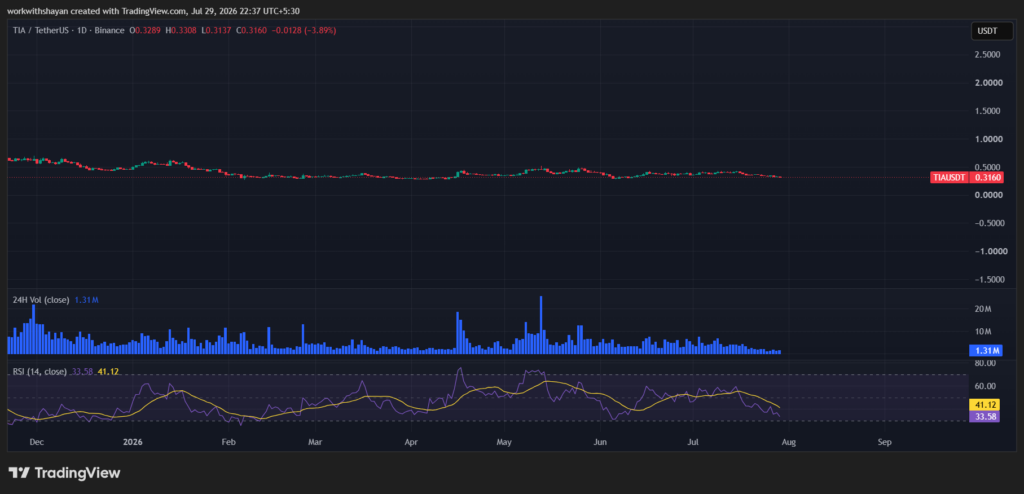
On the daily Celestia price chart, TIA faces rising selling momentum as sellers drove the price toward $0.31. The selling pressure triggered significant liquidations among buyers during the session. The 24-hour trading volume rose to $1.31 million, reflecting a modest increase in trading activity. TIA is currently trading at $0.31, having declined by over 4% in the past 24 hours.
The RSI-14 trend line has dropped from its previous level and hovers around the 33 mark, indicating that sellers are controlling momentum. The SMA-14 level suggests reduced volatility for the coming hours.
4-Hour Chart Analysis
The 4-hour TIA price chart indicates continued volatility around $0.31. Bears are positioning for dominance as the price prepares to hold below EMA lines.
The Balance of Power (BoP) indicator reads bullish at 0.28, suggesting buyers are attempting to build pressure near resistance levels to support an upward correction. Meanwhile, the MACD trend line has formed red candles above the signal line, with the indicator aiming for positive momentum that could strengthen buying positions.
Near-Term Outlook
The hourly price chart confirms that bears are working to prevent an immediate price surge. If TIA successfully breaks above $0.3566, it could advance toward the next resistance at $0.4216. Conversely, if bulls fail to drive a recovery, the price may fall below the immediate support at $0.2787, leading to a correction toward $0.2360.
Celestia Network Fundamentals
Celestia and modular rollups aim to enhance Ethereum's performance and scalability, influencing competition among Layer 1 public chains. Public chains such as BNB Chain and Celo have opted to integrate with Ethereum as L2 rollups, citing liquidity and cost advantages. Celestia's scalability and developer-friendly design position it as an appealing infrastructure choice, offering additional scalability to the blockchain ecosystem. The project has attracted notable venture backing, having raised funding from firms including Bain Capital Crypto and Polychain Capital ahead of its mainnet debut.
Celestia successfully completed its v9.0.4 network upgrade on July 1, during which exchanges briefly paused deposits and withdrawals while trading continued without interruption.
Celestia (TIA) Price Forecasts
July 2026 Forecast
The broader crypto market has been gaining momentum in recent weeks, with Bitcoin targeting the $70,000 level. For July, TIA is projected to record a minimum price of $0.3, a maximum of $0.5, and an average of $0.4.
2026 Forecast
Based on technical analysis of historical TIA price data, the price of Celestia is predicted to reach a minimum of $0.2, a potential maximum of $1.5, and an average trading price of $1.3 in 2026.
2027–2032 Forecasts
- 2027: Minimum $1.8, maximum $2.59, average $2.54
- 2028: Minimum $2.96, maximum $3.57, average $3.33
- 2029: Minimum $3.87, maximum $4.48, average $4.46
- 2030: Minimum $3.98, maximum $5.2, average $4.99
- 2031: Minimum $4.77, maximum $5.48, average $5.20
- 2032: Minimum $6.78, maximum $7.53, average $7.41
The source's analysis also notes that, depending on market conditions and adoption trends, the TIA price could potentially reach the $100 milestone by 2030, and may surpass $1,000 in subsequent years if the altcoin market remains strong and Celestia expands its utility offerings.
Celestia (TIA) Historical Price Sentiment
TIA entered the market on October 31, 2023, at an opening price of $2.10. The token entered a bullish phase on November 10 and peaked at $7.38 on November 18. Prices subsequently declined following news of Binance's regulatory fine, dropping to $5.30 by November 27. TIA then reached an all-time high of $15.14 on December 24, 2023, and closed the year at $11.86.
On March 11, 2024, TIA rose to $16.23. Through May, the price declined below $10 before recovering that level following Bitcoin's rebound. However, TIA declined steeply when Bitcoin pulled back toward $50,000 in June and July, pushing TIA below $5.
In August, TIA continued declining heavily, dropping below $4.2. During September and October, the price fluctuated between $3.5 and $6.8. November saw renewed buying demand push the price toward $9. December brought another sharp decline, with TIA closing 2024 below $5.
In January 2025, TIA dropped further to a low near $3.8. February saw another decline to approximately $2.3. In March, the price corrected downward toward $2.8 before recovering. By the end of April, TIA had risen toward $3. In May, the token reached $3.4 but failed to sustain momentum, resulting in a drop toward $2 in early June and further to $1.3 by the end of June.
In July 2025, TIA surged toward $2.3 but declined to $1.6 by early August. By the end of August, the price had fallen below $1.5 and continued consolidating below that level through September. In early November, TIA dropped below $1, and by the end of November it had declined to approximately $0.6. TIA closed December 2025 at $0.45.
In early January 2026, TIA briefly rose to $0.6. February brought a heavy decline to approximately $0.3, where the token remained through the end of March. In April, TIA recovered toward $0.43 before dropping to $0.4 in May. By the end of June, TIA was hovering around $0.35.
Source: Cryptopolitan. Price data referenced from TradingView and the Celestia official website.

