Cardano Price Prediction: Whales Shed 110M ADA as $0.23 Support Holds
Key Takeaways
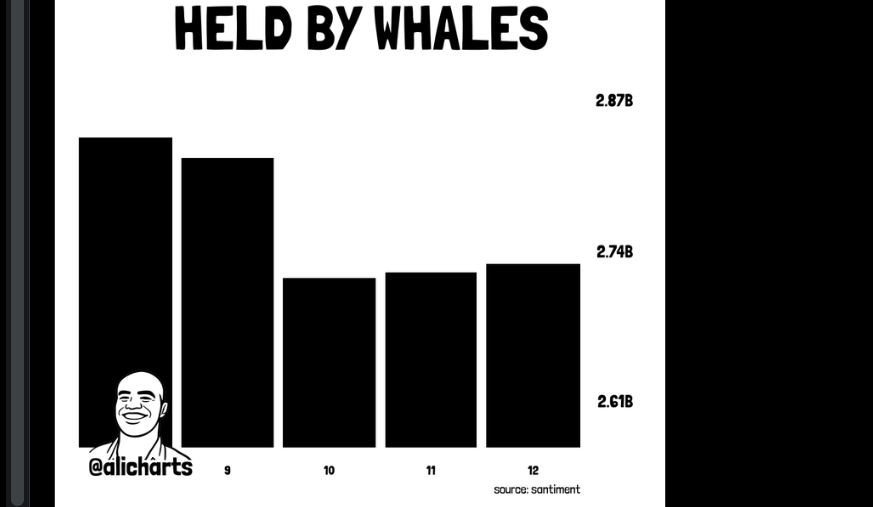
- •Large Cardano holders reduced their tracked balances by more than 110 million ADA, roughly $25.6 million at the $0.233 market price, over the five days starting Oct. 8.
- •Daily active addresses dropped 41.36%, from 27,248 to 15,977, during the measured period, pointing to weaker network participation.
- •Cardano's decentralized finance total value locked increased from 257.43 million to 279.88 million ADA, a gain of about 8.7%, even as the token's price declined.
- •CoinGlass derivatives data showed approximately $383 million in short-side trading volume versus about $342 million on the long side over 24 hours, with the long-to-short account ratio at 0.86 and below one since Oct. 5.
- •ADA fell beneath its 200-day exponential moving average and is testing $0.23 support, where a break could expose the $0.20 area while a recovery above the average could bring $0.27 back into focus.
Cardano's near-term outlook weakened on Oct. 13 as large holders continued reducing their balances amid sustained selling pressure. ADA traded near $0.233 after losing more than 14% over seven days, leaving the $0.23 support level facing another test.
Crypto analyst Ali Martinez reported that tracked whales cut their holdings by more than 110 million ADA over days. Daily active addresses fell sharply over the same stretch, adding to concerns about network participation, while derivatives data pointed to heavier short-side trading activity. Cardano's decentralized finance deposits, however, increased when measured in ADA.
Whales Reduce Holdings Over Five Days
According to Martinez, large Cardano holders offloaded more than 110 million ADA during the five days beginning October 8, a reduction that coincided with the token's latest weekly decline. At the market price of $0.233, those tokens carried a value of roughly $25.6 million, although their actual transaction prices remain unclear.
Large wallets can influence market liquidity when their owners move substantial quantities of tokens, which is why shifts in whale balances are widely watched as a read on how major holders are positioned. Still, changes in tracked balances do not reveal where every token went, or whether each movement involved a sale on an exchange. Cardano's price remained under pressure during the reporting period, with the decline following the reduction in whale holdings; broader market conditions and trading demand also affect ADA's market price.
Network Activity Drops While DeFi Deposits Rise
Figures shared by Martinez showed Cardano's daily active addresses falling from 27,248 to 15,977, a 41.36% decrease in the number of addresses interacting with the blockchain during the measured period. Active addresses measure network participation rather than the number of individual users.
DeFiLlama data, meanwhile, showed growth in Cardano's decentralized finance holdings. Total value locked — a common gauge of funds deposited across a chain's DeFi protocols — rose from 257.43 million ADA on October 6 to 279.88 million ADA, an increase of 22.45 million ADA, or approximately 8.7%, over the period covered by the figures. That increase in ADA terms ran counter to the token's recent price decline.
Derivatives figures from CoinGlass showed approximately $383 million in short-side trading volume over 24 hours, compared with about $342 million on the long side, a difference of $41 million. The figures indicated heavier short-side trading activity as Cardano's price sat near its weekly lows. The long-to-short account ratio stood at 0.86; readings below one indicate that short accounts outnumber long accounts in that measure, and the ratio had stayed below one since October 5, according to the reported data.
ADA Tests $0.23 After Moving Average Break
Cardano's daily chart showed ADA moving below its 200-day exponential moving average, a long-term trend indicator traders often use to frame an asset's broader direction. The price then approached the same indicator from below, turning the former support area into a potential resistance level. A sustained recovery above that average could bring the $0.27 region back into focus.
The token also traded within a rising channel that began in late June. However, ADA moved beneath the channel's midpoint, while the Awesome Oscillator, a momentum indicator, showed weakening upward momentum. The channel's lower boundary remains another level to monitor.
Near-term price attention centers on $0.23. A break beneath that level could expose the psychological $0.20 area, according to the chart setup. Conversely, a move back above the moving average would alter the immediate technical picture.
This article is for informational purposes only and does not constitute financial or investment advice.
This article was originally published by The Market Periodical.

