Cardano Price Could Repeat Its 2,000% Rally but Must First Reclaim Key Levels
Key Takeaways
- •Cardano's three-day chart recorded a TD Sequential nine-count and Sequential 13 buy signal near $0.191 after a 35.41% decline from $0.2822 to $0.1823.
- •Analysts identified $0.2268, $0.2677, $0.25, and $1.37 as price levels Cardano must reclaim on the path toward a sustained recovery, with $1.37 marking the threshold for a stronger bullish phase.
- •TD Sequential counts are generally treated as timing tools rather than confirmation, and Cardano still needs buyers to push the price higher and sustain any rebound.
- •Ethereum registered a completed TD Sequential buy signal on its three-day chart after falling 22.64% to $2,171, with $2,500 and a resistance trendline near $2,700 as potential recovery targets.
- •Solana's buy setup remains in formation after a 27.31% drop to $90.78, and if the sequence completes with $90 support intact, the next levels stand at $105 and approximately $120.
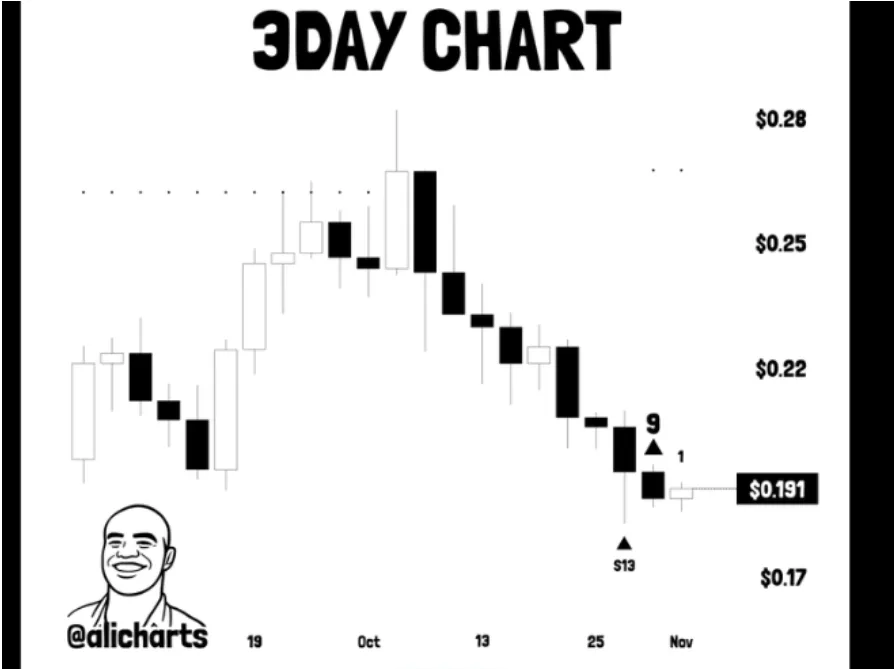
Cardano (ADA) is showing an early technical indication of a possible rebound after weeks of declining prices. Analyst Ali Martinez identified a TD Sequential buy signal on the token's three-day chart, with ADA trading near $0.191. The development follows a sharp correction that has pushed Cardano below several recovery levels, and separate analysis has outlined the prices the token must regain before a larger bullish move becomes possible. According to the analysis, Cardano must first reclaim $0.25 before targeting $1.37, a key level for a stronger bullish recovery. Because the same indicator has flagged possible turning points on Ethereum and Solana as well, the levels involved also serve as a shared reference for readers tracking several major altcoins at once.
TD Sequential Buy Signal Emerges Near $0.191
Martinez's analysis places Cardano among three major altcoins showing possible signs of a reversal. ADA dropped 35.41% during its recent decline, falling from $0.2822 to $0.1823. The token's three-day chart then recorded a TD Sequential nine-count and a Sequential 13 buy signal near the lower end of that trading range.
The TD Sequential indicator, developed by market technician Tom DeMark, tracks consecutive price movements to identify when an existing trend may be running out of momentum. A nine-count can signal that selling pressure is tiring, while a completed 13-count provides an additional possible reversal indication. Traders generally treat such counts as timing tools rather than confirmation, since a sequence can reset if the prevailing trend resumes.
That distinction matters here. Despite the signals, Cardano still needs buyers to push the price higher and sustain any recovery. The newest candles remain near recent lows, and ADA has not yet recovered the higher prices that preceded its October slide.
ADA Faces a Series of Recovery Tests
Martinez identified $0.2268 as the first upside level for Cardano. A recovery above that price would bring resistance around $0.2677 into consideration. Both targets remain above the $0.191 level shown on the latest three-day chart, leaving ADA with ground to recover before reaching the upper target. In technical analysis, levels an asset loses on the way down are commonly watched as the first obstacles on the way back up, which is why the two analyses effectively read as a checklist for any recovery attempt.
Another market analyst, 360Trader, has identified $0.25 as a separate hurdle. Cardano would need to rise roughly 31% from $0.191 to reach that level, which represents another test of whether buyers can maintain a recovery beyond the first rebound.
360Trader places a much higher threshold at $1.37, a price he associates with the start of a stronger bullish market phase for ADA. Reaching that point would require a sustained advance well beyond the short-term targets.
The analyst also compared Cardano's current weekly structure with the base that preceded its previous major market advance. ADA gained roughly 2,000% during that cycle and reached a record price of $3.10 in September 2021. A repeat of a 2,000% gain from $0.191 would place ADA near $4.01. Such comparisons describe past cycles rather than project future ones, and the analyst has not set a date for a repeat of the previous cycle. Cardano has yet to reclaim the nearer levels identified in his analysis.
Taken together, the two analyses outline a series of levels ADA would need to reclaim, including $0.2268, $0.25, $0.2677 and $1.37, on the way toward a more sustained recovery. Until the nearer levels are recovered, the higher thresholds remain checkpoints further along the path.
Ethereum and Solana Show Similar Three-Day Setups
Martinez also identified a completed TD Sequential buy signal on Ethereum's three-day chart. ETH fell 22.64% from $2,806 to $2,171 before the indicator appeared. A recovery could take Ethereum toward $2,500, while a move above that level would place a resistance trendline near $2,700 in focus.
Solana has also developed a possible buy setup after falling 27.31% from $124.89 to $90.78. Martinez said the signal was still forming. If the sequence completes and SOL holds support near $90, the next recovery levels stand at $105 and approximately $120.
The three setups place Cardano, Ethereum and Solana among the major altcoins the analyst is tracking for possible reversals. They also give readers a concrete watchlist drawn from the analyses themselves: whether ADA can reclaim $0.2268 and then $0.25, whether ETH can reach the $2,500 area, and whether Solana's forming sequence completes with the $90 support intact.
Disclaimer
This article provides market information, not investment advice. Cryptocurrency investments involve volatility and potential losses. Readers should conduct independent research before making investment decisions.

