Cardano Price Prediction: ADA Faces 20% Drop After Channel Breakdown
Key Takeaways
- •Cardano traded near $0.205 on Oct. 25, 2026, down roughly 26% from its Oct. 6 high of $0.2823.
- •ADA fell beneath the lower boundary of a four-month ascending channel that had guided its climb from about $0.138 in late June to $0.282 in early October.
- •Analyst Ali Martinez indicated that a failure to recover the $0.220 resistance could open a path toward $0.166, roughly 20% below prevailing levels.
- •A separate Elliott Wave assessment by analyst V outlined a deeper downside scenario near $0.14, close to the June trough of $0.1384.
- •Both bearish projections are conditional, with a sustained recovery above $0.220 or the broken channel structure potentially negating the stated downside targets.
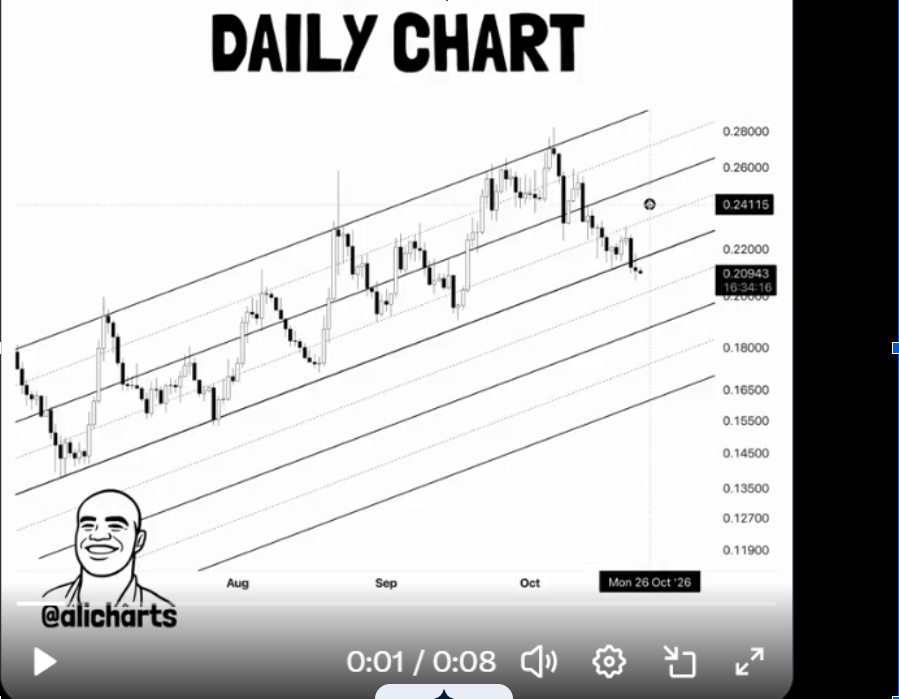
Cardano (ADA), the native token of the proof-of-stake Cardano blockchain, remained under bearish pressure on Oct. 25, 2026, with the token trading around $0.205 and extending its losses for the month. ADA has retreated roughly 26% from its Oct. 6 high of $0.2823, erasing much of the recovery built over the summer. Following the reported breakdown of a four-month ascending channel, analysts Ali Martinez and V have laid out separate downside scenarios, placing $0.166 and $0.14 among the levels traders were monitoring, according to an Oct. 26 report by The Market Periodical.
Cardano Slips Out of Four-Month Rising Channel
Cardano began its recovery near $0.138 in late June 2026. Buyers gradually pushed the token higher through July, August and September, despite several pullbacks along the way. By early October, Cardano had reached $0.282 — more than double its price at the start of that advance.
Throughout the climb, the price moved between two upward-sloping lines. The lower boundary connected areas where declines had previously stopped, while the upper line marked the broader range of the rallies. Together, those boundaries formed the parallel channel that guided the advance, serving as the technical framework for the entire four-month rally.
In technical analysis — the practice of framing potential price paths from chart structure rather than project fundamentals — a decline beneath a channel's lower boundary is conventionally read as invalidating the pattern. Recent trading has disrupted that structure. A fresh retreat carried ADA beneath the lower line, ending its run within the channel. In his latest chart (shared on X), market analyst Ali Martinez placed Cardano around $0.209 after the break, with the price sitting below the former support boundary and the October high well above the market.
The reversal followed several weeks of weakness after ADA approached the upper part of the channel. Instead of returning to its earlier trading range, the latest candles moved under the lower trendline — a development that forms the basis of the current downside forecasts.
Will ADA Reclaim $0.220?
The $0.220 mark now serves as the resistance level in the Cardano price prediction — in chart terms, a price zone where upward moves have historically stalled or turned lower. The token traded above that area during much of its earlier advance, but the recent downturn carried it back beneath. The forecast depends on ADA remaining below that threshold.
According to the analysis, a failure to recover $0.220 leaves room for a move toward $0.166 — a decline of roughly 20% from current levels. The projected target also sits below $0.20, a threshold Cardano crossed during its summer recovery and one of the round-number levels traders commonly watch. Conversely, a sustained rise back above $0.220 would remove the stated condition for the $0.166 scenario.
Cardano has already surrendered a portion of its gains since the October peak. Its position beneath the channel means the lower trendline that once marked buying support no longer contains the price.
Elliott Wave Outlook Points Toward June Low
A separate Elliott Wave assessment sets out a deeper scenario near $0.14. Elliott Wave analysis is a charting method that reads price movement as a sequence of waves tied to recurring patterns in market behavior, and analysts use the resulting counts to frame potential targets. That forecast emerged as ADA traded near $0.217 and approached the bottom of its ascending channel, a stage at which the lower trendline remained the condition to watch for a further decline.
The $0.14 target stands near the June trough of $0.1384 — the area Cardano last visited before beginning the rally that carried it toward $0.28 in October. A return to that zone would place the price back where the four-month recovery started.
Elliott Wave analyst V identified a clear channel break as the confirmation needed for that bearish path. The outlook therefore differs from an unconditional call for ADA to reach a new low: the projection depends on whether the price can recover its previous trading structure.
This article is for informational purposes only and does not constitute financial advice. Cryptocurrency investments carry substantial volatility and potential losses. Readers should conduct independent research before making investment decisions.
Source: The Market Periodical

