Cardano (ADA) Climbs 11% to Test $0.28 Resistance
Key Takeaways
- •Cardano rose 11% in 24 hours, trading in a $0.24-$0.27 range and last near $0.27, just below the $0.28 resistance level that remains the key level traders are watching.
- •Open interest fell 11.68% while price climbed 11%, a divergence the analysis links to a short squeeze driven by covering flows rather than fresh demand.
- •The rally was supported by $84.8 million in Binance spot volume, and ADA is trading above its 7-, 20-, 50-, and 200-day moving averages.
- •Momentum readings are mixed, with the MACD histogram flattened at zero, the RSI at 69.66 just under overbought, and the stochastic oscillator at 93.46 deep in overbought territory.
- •The analysis assigns a 55% probability to a bullish scenario targeting $0.29 and then $0.32-$0.34, against a 45% bearish path in which a defense of $0.28 sends ADA back to $0.25 support.
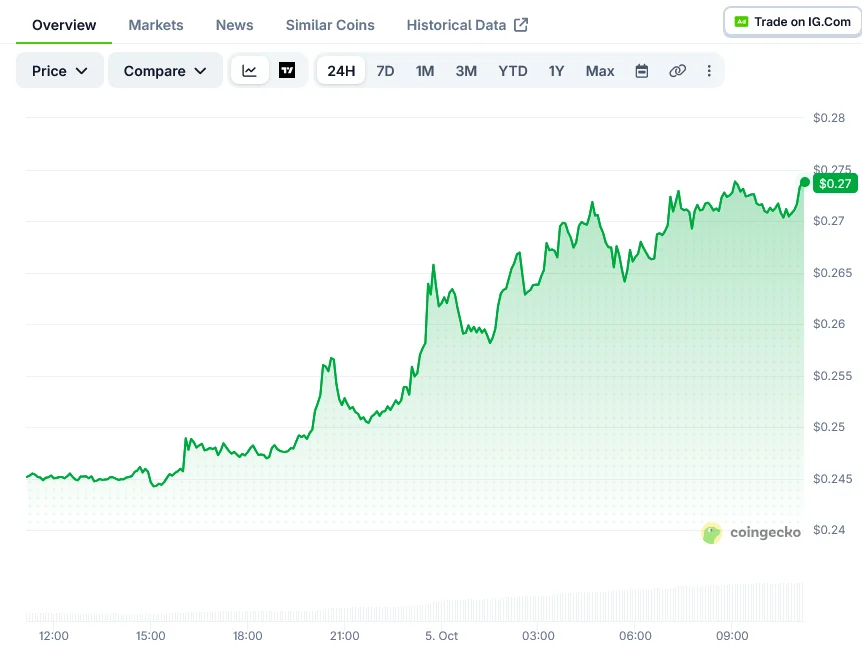
Cardano (ADA) climbed 11% over the past 24 hours, trading between $0.24 and $0.27, according to a report from Blockonomi. The token was last changing hands near $0.27, close to the top of its 24-hour range and just below immediate resistance at $0.28, with stronger resistance positioned at $0.29.
The advance was backed by tangible trading activity rather than thin liquidity. Spot volume on Binance reached $84.8 million over the same 24-hour period. In recent weeks, Layer-1 tokens such as ADA and SOL have moved more sharply than Bitcoin in both directions, a pattern that resurfaced in this session as overall market sentiment turned positive. Cardano runs as a proof-of-stake Layer-1 blockchain, settling transactions and staking on its own base network.
According to a Blockchain.news analysis cited in the report, the rally pushed out short sellers positioned below $0.26. Price then ran into the upper Bollinger Band at $0.28 — the upper of the volatility bands plotted around a moving average — where the initial push stalled.
Technical Indicators Show Mixed Signals
ADA is trading above all of its major moving averages: the 7-day simple moving average (SMA) sits at $0.25, the 20-day at $0.24, the 50-day at $0.22, and the 200-day at $0.21.
Momentum readings are less conclusive. The MACD histogram has flattened at zero, suggesting the buying push behind the rally has slowed. The Relative Strength Index (RSI), a momentum gauge running from 0 to 100, stands at 69.66, just under the overbought threshold of 70, while the stochastic oscillator reads 93.46, deep in overbought territory.
ADA's Bollinger %B is 0.91, placing price close to the upper band. The band's midline sits at $0.24, and the pivot point is at $0.26. The average true range (ATR) is $0.02, giving the token room to move roughly $0.02 in either direction within a single session.
Derivatives Data and Key Levels
Open interest — the total number of outstanding derivatives contracts — fell 11.68% over 24 hours while price climbed 11%, meaning traders were closing existing positions rather than opening new ones. The analysis links this pattern to a short squeeze, in which short sellers were forced to cover and pushed price higher. That divergence between rising price and falling open interest points to covering flows rather than fresh demand, as new long positions did not chase the move in large numbers — making a rebuild in open interest alongside price one gauge of whether new positioning is joining any further advance.
Positioning nonetheless still leans bullish. Top traders are 71.9% net long, with a long/short ratio of 2.55, while retail traders are 68.5% long. The taker buy/sell ratio stands at 1.135, indicating more aggressive buying than selling, and funding rates — the periodic fee exchanged between perpetual futures traders to keep contract prices aligned with spot — are neutral at 0.01%.
The analysis assigns a 55% probability to a bullish path. Under that scenario, ADA would hold the $0.25-$0.27 range for three to seven days before closing above $0.28, with $0.29 and then $0.32 to $0.34 as subsequent targets. The bearish path carries a 45% probability: sellers defend $0.28 and ADA falls back to $0.25 support, with $0.23 as the next support level. A daily close below $0.25 would invalidate the bullish outlook, and a close below $0.23 would end the short-term recovery setup.
At the time of writing, ADA traded at $0.27, up 0.18% on the latest one-minute data, per CoinGecko. The $0.28 level remains the main resistance traders are watching.

