Cardano Price Analysis: ADA Battles to Defend Its Breakout Above $0.26
Key Takeaways
- •ADA traded near $0.269 on October 5 after reaching $0.276, with the advance forming a higher low above September's swing bottom around $0.189.
- •Price moved through the $0.254-$0.260 resistance, which now serves as the first support test and is reinforced by the 0.236 Fibonacci retracement at $0.256.
- •The $0.238-$0.247 area forms the stronger nearby floor, and trading below it for several sessions would shift attention to the $0.220-$0.224 and $0.208-$0.218 zones.
- •The immediate upside hurdle lies at $0.274-$0.280, near the recent wick high of $0.276 and the round $0.28 level.
- •The 14-day relative strength index stood near 69.02, above its smoothing line at 63.14, indicating strong momentum approaching an extended reading.
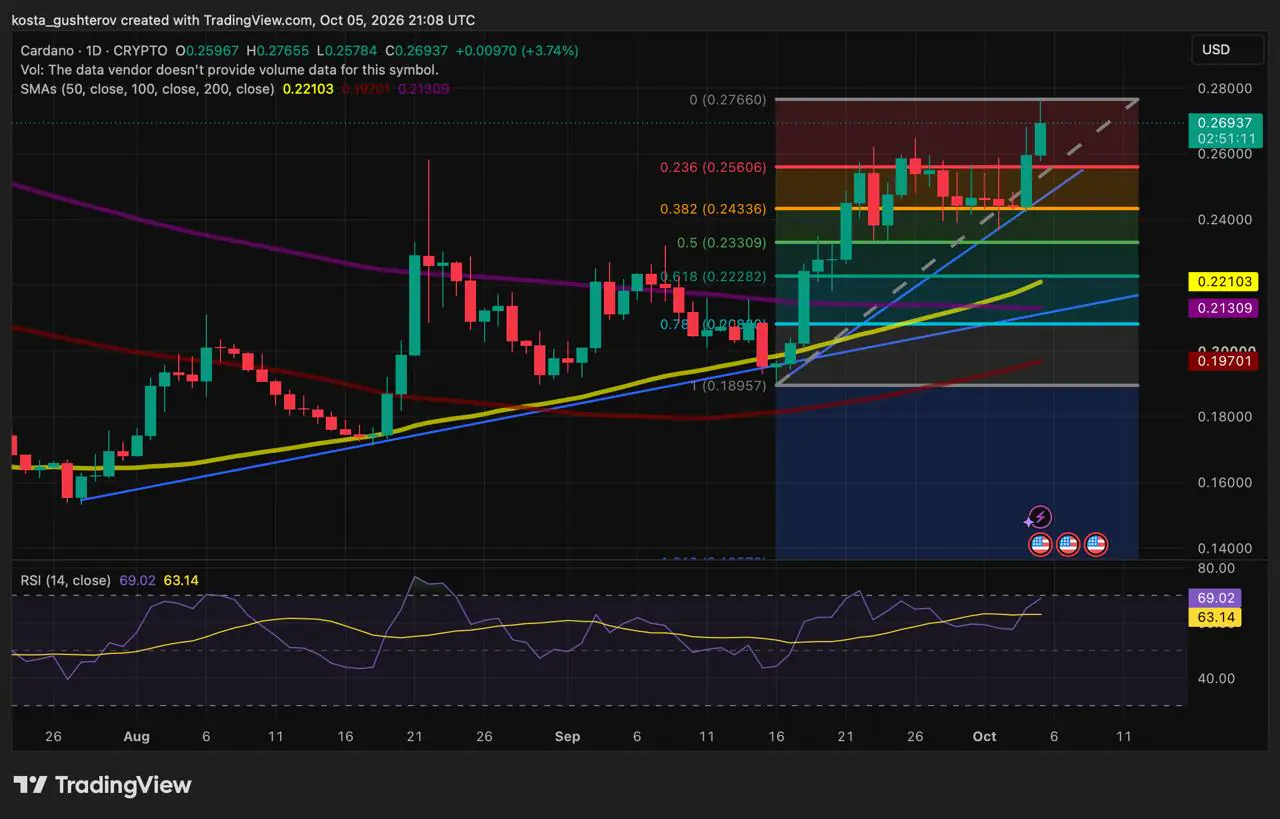
Cardano's native token, ADA, traded near $0.269 at 21:08 UTC on October 5 after reaching $0.276 on the daily chart, having printed a wick high of $0.27655. ADA is the asset used to pay fees and to stake on Cardano, a proof-of-stake blockchain network. The advance followed a pullback that found buyers near $0.24, leaving a higher low above September's swing bottom around $0.189 and clearing the $0.254-$0.260 resistance area. That reclaimed zone stands as the first test for buyers, with $0.238-$0.247 forming the stronger nearby floor should the breakout cool.
The recovery from $0.24 gave ADA another attempt at the $0.255-$0.260 area, where several recent daily candle bodies had stalled. Price has now moved through that ceiling, although the daily candle was still open at the chart's timestamp. That makes the former ceiling the chart's immediate point of pressure: buyers have moved through it, and their next task is to keep ADA from settling back below it.
The reclaimed zone becomes the first support test
The $0.254-$0.260 area formed the upper edge of ADA's recent consolidation, and crossing it placed price above the range that had repeatedly held back the recovery. The 0.236 Fibonacci retracement at $0.256 sits within the same zone, the steeper rising trendline on the chart approaches it, and the latest daily candle found intraday support near $0.257. Fibonacci retracements are standard ratios of a prior price swing that charting tools plot as potential pause zones for pullbacks, which is why they tend to carry more weight where they line up with horizontal ranges like this one.
A pullback toward this range would show whether the sellers who capped ADA near $0.26 have been replaced by buyers. When a former ceiling begins to act as a floor, it suggests the balance between buyers and sellers has shifted, and that support-resistance reversal is one of the signals traders use to judge whether a breakout is settling into place, as Fidelity explains.
What could strengthen the move? A daily close above $0.254-$0.260, followed by a pullback that holds within the zone and leads to another rebound, would show buyers defending the ground gained during the latest advance. A brief wick below the range would carry less weight than repeated daily closes beneath it, particularly if later rebounds fail to regain the former ceiling.
Wider support areas below $0.26
A failed retest would weaken the immediate breakout, yet ADA would still have room to preserve the recovery. The chart groups its deeper references into zones where Fibonacci levels, earlier price reactions, moving averages, and rising trendlines overlap. Fibonacci levels use the chart's move from the September low near $0.18957 to the current high near $0.27660; a higher high would change the retracement values.
Losing $0.254-$0.260 would weaken the immediate breakout, but ADA could keep its recent higher-low structure intact by holding the $0.238-$0.247 area. That zone contains the 0.382 retracement and the pullback reactions that built the base for the latest move.
Trading beneath $0.238-$0.247 for several sessions would shift attention toward the $0.220-$0.224 and $0.208-$0.218 pockets. A break below $0.189-$0.200 would carry greater weight, because it would undercut the September low and the wider recovery structure.
$0.274-$0.280 is the immediate upside hurdle
Holding the reclaimed range would bring the latest wick high at $0.276 and the round $0.28 level back into focus. A close through that area, followed by sustained trading above it, would show that buying interest continued after the initial break above $0.26 rather than fading immediately.
Whether ADA clears that hurdle will depend partly on whether momentum can keep pace with price. The 14-day relative strength index stood near 69.02, above its smoothing line at 63.14, a sign of strong momentum approaching an extended reading. Readings near or above 70 are commonly described as overbought because they reflect a strong recent advance, and as Fidelity's RSI guide notes, the indicator can remain elevated while a trend continues. A rejection near $0.28 would therefore matter most through its effect on the support areas below.
ADA's next daily closes could show whether the move has created support or only produced a brief push above resistance. Staying above $0.254-$0.260 may keep $0.274-$0.280 in play, while a sustained loss of $0.238-$0.247 would likely move the recovery into a deeper test.
Chart source: TradingView, ADA/USD daily chart, October 5, 2026, at 21:08 UTC.
This article is for informational purposes only and does not constitute investment advice. Technical levels are approximate and do not guarantee future price movements. first appeared on Coindoo.

