2026 Week 30 Bitcoin Market Watch: BTC Holds Near $65K as ETF Demand Fades and Spot Demand Stays Fragile
Key Takeaways
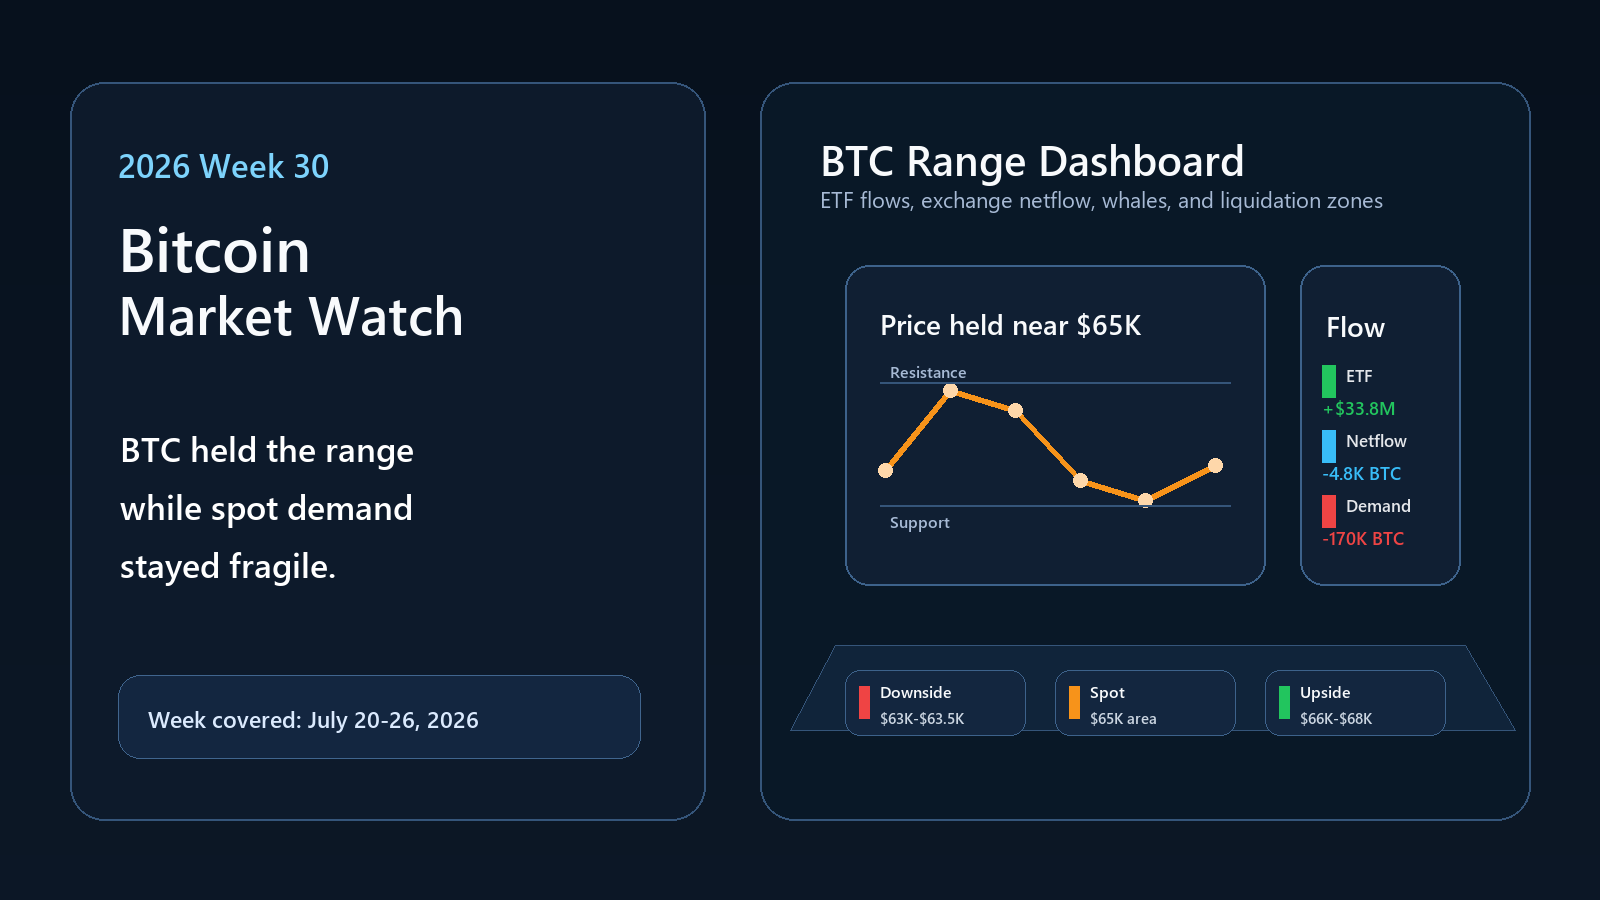
- •Bitcoin gained only about 0.22% for the week and remained range-bound between roughly $64,103 and $66,556.
- •U.S. spot Bitcoin ETFs recorded about $33.8 million of net inflows for the week, but roughly $465 million of outflows on July 23 and July 24 weakened the demand picture.
- •CryptoQuant exchange netflow ended the week at about -4,817 BTC, but the final three days showed positive inflows back to exchanges.
- •Whale vs Retail Delta stayed positive every day and averaged about 0.133, although the reading fell to 0.086 by July 26.
- •CryptoQuant-linked data showed 30-day apparent spot demand near -170,000 BTC, indicating that organic spot demand remained weak.
Bitcoin Market Setup for Week 30
Week 30 was not a dramatic Bitcoin week on price alone. The CoinGlass Whale vs Retail Delta snapshot placed BTC near $65,255 on July 20 and near $65,400 on July 26. The high in the reviewed readings came on July 21 near $66,556, while the low came around July 24 near $64,103-$64,140, depending on whether the exchange-netflow or whale-delta price column is used.
That means Bitcoin did not collapse when equity markets weakened and oil-driven inflation risk dominated macro headlines. It also did not break out. The better description is range defense. Buyers kept BTC from losing the low-$64,000s, but the market failed to turn early-week strength into a strong weekly close above the July 21 high.
That matters because the surrounding data were not uniformly supportive. ETF inflows were positive for the week, but barely. Exchange netflow looked constructive only if traders focus on the whole-week sum and ignore the late-week turn. Whale delta stayed positive, but it weakened by Sunday. Spot demand context remained the largest warning: a CryptoQuant-linked update said 30-day apparent spot demand had slipped back toward about -170,000 BTC after improving toward -80,000 BTC earlier in July.
The price held, but the bid did not broaden
The most important Week 30 message is that price stability did not equal broad accumulation. A market can hold a range because sellers pause, shorts cover, ETFs absorb some supply, or leverage clusters pull price toward liquidity. Those forces can all support price temporarily. They are not the same as a strong spot bid.
That is why the article’s core question is not whether BTC was up or down for the week. It is whether the buyers behind the move looked durable. In Week 30, the answer was mixed at best.
The macro backdrop made that distinction more important. Week 30 was also the week when oil risk, equity rotation, and pre-Fed positioning kept traders sensitive to liquidity conditions. Bitcoin did not trade in isolation. It was being judged against the same question facing stocks and commodities: were investors still willing to hold risk when inflation tail risk and higher-yield pressure returned to the conversation?
Week 30 Bitcoin Dashboard
| Signal | Week 30 Reading | Market Meaning |
|---|---|---|
| BTC weekly move | About +0.22% from July 20 to July 26 | Range defense, not a breakout |
| Weekly high | About $66,556 on July 21 | Early-week strength faded |
| Weekly low | About $64,103-$64,140 on July 24 | Buyers defended the low-$64,000s |
| Whale vs Retail Delta average | About 0.133 | Positive, but uneven |
| Whale vs Retail Delta close | 0.086 on July 26 | Weakest reading of the week |
| Exchange netflow total | About -4,817 BTC | Weekly outflow, but late-week inflows returned |
| Spot Bitcoin ETF weekly flow | About +$33.8 million | Positive but weak after late-week outflows |
| 30-day apparent spot demand | Near -170,000 BTC | Organic spot demand remained weak |
The dashboard shows why Week 30 should be read cautiously. Almost every signal had a constructive side and a warning side. Price held, but did not run. Whale delta stayed positive, but faded. Netflow was negative for the full week, but positive for the final three days. ETFs stayed positive on the week, but only after early inflows were almost erased by late selling.
That kind of mixed tape is exactly where weekly Bitcoin analysis needs to slow down. A bullish reader can point to the fact that BTC did not lose the range even as ETFs leaked late in the week. A bearish reader can point to the fact that the market needed early ETF inflows and one large exchange outflow to avoid looking weaker. Neither side had full control. The range held because several signals were good enough, not because the demand picture was clean.
ETF Demand Was Positive, But Barely
The ETF flow story was one of the most important Week 30 signals because it showed how quickly institutional demand softened. CoinDesk reported that U.S. spot Bitcoin ETFs attracted about $33.79 million in the week ended July 24, their third consecutive weekly inflow. That headline sounds constructive until the daily path is included.
The same report said the funds saw roughly $225.2 million of outflows on July 23 and $240.1 million on July 24. In other words, about $465 million left in two sessions and nearly erased the week's earlier inflows. Bitcoin Mastery, citing Farside and SoSoValue data, showed the daily flow path as +$226.8 million on July 20, +$203.2 million on July 21, +$69.1 million on July 22, then -$225.1 million and -$240.1 million on July 23-24.
Late-week outflows changed the message
That path matters more than the weekly total. A clean accumulation week would show steady inflows or at least a strong finish. Week 30 showed the opposite: early buying and late de-risking. The result was technically positive, but the quality of demand was weak.
For Bitcoin, that is not a small detail. ETF inflows have been one of the cleanest institutional-demand channels in this cycle. When ETF demand weakens at the same time spot demand remains negative, the market has less margin for error if macro conditions deteriorate.
The timing also matters. The outflows arrived just before the following week's Federal Reserve decision, which means they may have reflected pre-event risk reduction rather than a structural rejection of Bitcoin exposure. That is the generous interpretation. The stricter interpretation is that ETF buyers were less willing to add exposure once BTC failed to extend above the mid-$66,000s. Week 31 flow data will decide which interpretation holds.
Exchange Netflow Was Not a Clean Accumulation Signal
CryptoQuant exchange netflow readings for July 20-26 showed a full-week total of about -4,817 BTC. On the surface, that looks constructive because negative netflow means more BTC moved out of exchanges than into them. The issue is that most of that signal came from one day.
July 20 showed a large outflow of -9,799 BTC. After that, the daily picture was mixed: +2,777 BTC on July 21, -1,363 BTC on July 22, -354 BTC on July 23, then +2,638 BTC, +666 BTC, and +618 BTC from July 24 through July 26. The week therefore ended with three straight positive netflow days.
That weakens the accumulation argument. If BTC had closed the week with persistent exchange outflows, the range defense would look stronger. Instead, the late-week inflows arrived as price was trying to recover from the July 24 low.
There is still a constructive side. The full-week total was negative, and the July 20 outflow was large enough to matter. But weekly totals can hide a changing tape. Traders should not treat the -4,817 BTC sum as a simple bullish label when the final three days moved in the opposite direction. The better reading is that accumulation pressure appeared early, then faded into a more defensive late-week setup.
Spot Demand Was the Core Weakness
The 30-day spot-demand figure is not a weekly metric, but it helps explain why Week 30 did not deserve an aggressively bullish interpretation. CryptoQuant-linked context showed Bitcoin's 30-day apparent spot demand had weakened back toward roughly -170,000 BTC, after briefly improving toward about -80,000 BTC earlier in July.
That matters because Week 30 price action could otherwise look healthier than it was. BTC defended the range. Whale delta stayed positive. ETFs were still slightly positive for the week. Yet if apparent spot demand is deeply negative, the market is still absorbing supply poorly at the organic spot level. In that environment, rallies are more dependent on ETFs, derivatives positioning, short covering, or liquidity clusters.
Derivatives can stabilize price without fixing demand
This is the key distinction. Futures activity and short covering can help BTC hold a level, but they do not prove that spot buyers are accumulating coins in size. A range can look stable until leverage thins out. When spot demand is negative, the market is more vulnerable to reversals if ETF flows slow or exchange inflows return.
Week 30 gave exactly that mix: stable price, positive but fading whale delta, weak late-week ETF flows, and positive exchange netflow into the weekend. That does not mean a breakdown was guaranteed. It means the burden of proof stayed with the bulls.
Whale vs Retail Delta Stayed Positive, Then Faded
CoinGlass Whale vs Retail Delta was the most constructive positioning signal. The readings stayed positive every day from July 20 through July 26, with a weekly average near 0.133. That suggests larger-market behavior remained more constructive than retail behavior for most of the week.
The pattern, though, was not a straight accumulation wave. The strongest reading was 0.169 on July 24, when BTC was near the weekly low area. That can be read as larger traders showing activity into weakness. But the final reading fell to 0.086 on July 26 even as BTC recovered toward $65,400.
Positive is not the same as strengthening
That distinction matters. Positive whale delta can support a range, but a fading reading into the weekly close does not confirm expanding conviction. It says whales were present, not that they were becoming more aggressive.
For Week 31, a healthier structure would show whale delta staying positive while exchange netflow turns negative again and ETF outflows stop. If whale delta weakens while ETF demand and spot demand remain soft, BTC may have fewer supports under the mid-$60,000s.
The July 24 reading deserves special attention because it was the highest whale-delta value of the week while BTC was near its weakest price area. That can be interpreted as larger traders becoming active into the dip. But the follow-through was less impressive. By July 26, price had recovered, while whale delta had fallen to the week's lowest reading. In a stronger accumulation week, traders would prefer to see whale participation expand into the recovery, not fade as price stabilizes.
Liquidation Map: Downside Risk Was Still Visible
The Binance BTC/USDT liquidation heatmap used a 2-week CoinGlass view from July 28, so it belongs to the forward-looking risk setup rather than the July 20-26 weekly performance calculation. It showed BTC pressing toward the lower end of the visible range after the review week.
The clearest downside liquidity appeared around roughly $63,000-$63,500, with another visible band closer to $61,600-$62,300. Upside liquidity was visible around roughly $65,800-$66,800, with additional bands extending toward about $68,000-$69,000.
Liquidation maps are not forecasts. They are pressure maps. If BTC loses the low-$63,000s, downside long-liquidation risk can matter quickly. If BTC reclaims the mid-$66,000s, upside short-liquidation bands become relevant. Week 30 ended with price still inside that two-sided structure.
The heatmap also explains why the market can feel more fragile than the weekly close suggests. A close near the mid-$65,000s sounds calm, but the map showed meaningful leverage both above and below. That means BTC did not need a large macro shock to move quickly. It only needed a push into one of the visible liquidity bands.
Scenario Map for Week 31
| Scenario | What Would Confirm It | What Would Weaken It |
|---|---|---|
| Bullish range recovery | BTC reclaims $66,500-$66,800, ETF flows turn positive again, and exchange netflow flips back negative. | BTC stalls below the upside liquidation bands while spot demand stays deeply negative. |
| Choppy consolidation | BTC holds $64,000-$66,500 with mixed ETF flows and positive but moderate whale delta. | A decisive break through either side with flow confirmation. |
| Bearish liquidation test | BTC loses $63,000-$63,500 and exchange inflows expand. | Whale delta strengthens into weakness and ETFs absorb the drawdown. |
This scenario map keeps the next step practical. Bulls do not need BTC to explode higher immediately, but they do need the quality of demand to improve. Bears do not need a macro crash, but they do need price to push below the range floor with confirming exchange inflows or ETF outflows.
What to Watch Next Week
The first checkpoint is ETF flow. Week 30's +$33.8 million weekly inflow was technically positive, but the late-week outflow cluster was the real warning. If flows stabilize after July 24, traders can treat the selloff as pre-Fed de-risking. If another week of outflows follows, the institutional-demand picture worsens.
The second checkpoint is exchange netflow. A return to negative netflow would help the accumulation case. Continued positive netflow would suggest more coins are moving back toward exchanges while spot demand remains weak.
The third checkpoint is the low-$64,000s. That area held during Week 30. If it breaks, the liquidation map's downside bands become more important. If BTC reclaims the July 21 area near $66,500, the market can argue that Week 30 was a pause rather than a failed recovery.
Trade Bitcoin With Leverage - Without Giving Up Custody
Decentralized perpetual exchanges have moved well past niche status. According to CoinGecko's 2025 Annual Crypto Report, DEX perpetual trading volume surged 346% last year, reaching $6.7 trillion, while centralized exchange open interest fell 20.8% over the same period. Traders are committing serious capital to on-chain derivatives, and the reasons are straightforward: counterparty risk is real, custodial failures happen, and censorship resistance matters.
edgeX is a decentralized perpetual futures exchange built for traders who want market access without sacrificing control. Here's what sets it apart:
- No KYC, no barriers. Connect a wallet and start trading. No identity verification, no account approvals. Onboarding is fast regardless of where you're based.
- True self-custody. edgeX combines off-chain order matching with verifiable on-chain settlement secured by Ethereum. Forced-withdrawal mechanisms keep your funds recoverable directly from the blockchain, even if the operator goes dark.
- Deep liquidity, tight spreads. edgeX maintains $10 million of market depth within a one-basis-point spread, with sub-0.1-basis-point slippage on trades exceeding $100,000. When Bitcoin moves fast, that precision matters.
- Up to 100x leverage. Scale positions to match your conviction, whether you're hedging exposure or trading momentum.
- 140% trading fee rewards. Active traders can earn back more than they pay in fees, reducing the net cost of high-frequency strategies over time.
- Institutional-grade infrastructure. edgeX processes up to 200,000 orders per second with matching latency below 10 milliseconds, delivering performance on par with major centralized exchanges without the custody trade-offs.
Start trading BTC/USDC perpetual futures on edgeX and put your market view to work.
Frequently Asked Questions
What week does this Bitcoin Market Watch cover?
This Bitcoin Market Watch covers 2026 Week 30, from July 20 to July 26, 2026. The July 28 liquidation heatmap is used only for the forward-looking risk map, not for the weekly price calculation.
Was Bitcoin bullish or bearish in Week 30?
Bitcoin was range-bound and fragile. Price held near the mid-$65,000 area, but ETF demand weakened late in the week, exchange netflow turned positive over the final three days, and 30-day apparent spot demand remained deeply negative.
Did Bitcoin ETFs support BTC during Week 30?
Only weakly. U.S. spot Bitcoin ETFs still recorded about $33.8 million of net inflows for the week ended July 24, but roughly $465 million left the funds on July 23 and July 24.
What was the strongest on-chain or positioning signal?
Whale vs Retail Delta stayed positive every day, averaging about 0.133. The caution is that the reading faded to 0.086 by July 26, so it did not show strengthening conviction into the close.
How should traders read the liquidation heatmap?
Use it as a risk map, not a price forecast. The July 28 CoinGlass heatmap showed visible downside liquidity around roughly $63,000-$63,500 and $61,600-$62,300, while upside bands were visible around roughly $65,800-$66,800 and $68,000-$69,000.

