Bitcoin Market Watch, Week 29 of 2026: BTC Reclaims Short-Term Moving Averages, but Spot Demand Is Still Contracting
Key Takeaways
- •BTC reclaimed its 20-day and 50-day moving averages in Week 29 but remained below the 200-day moving average near $73,089.
- •CryptoQuant data showed 30-day spot demand stayed in contraction, roughly between -78,000 and -170,000 BTC.
- •U.S. spot Bitcoin ETFs recorded about +1,200 BTC in net inflows across the five reported trading days after a large outflow on July 13.
- •Exchange net flow for July 13–19 was approximately +857 BTC, reflecting a slight net inflow and no clear accumulation signal.
- •The July 20 liquidation map showed upside pressure near $65,300, $66,100, and $67,300–$67,700, with downside zones near $63,600–$64,000 and lower levels.
Bitcoin Market Structure in Week 29
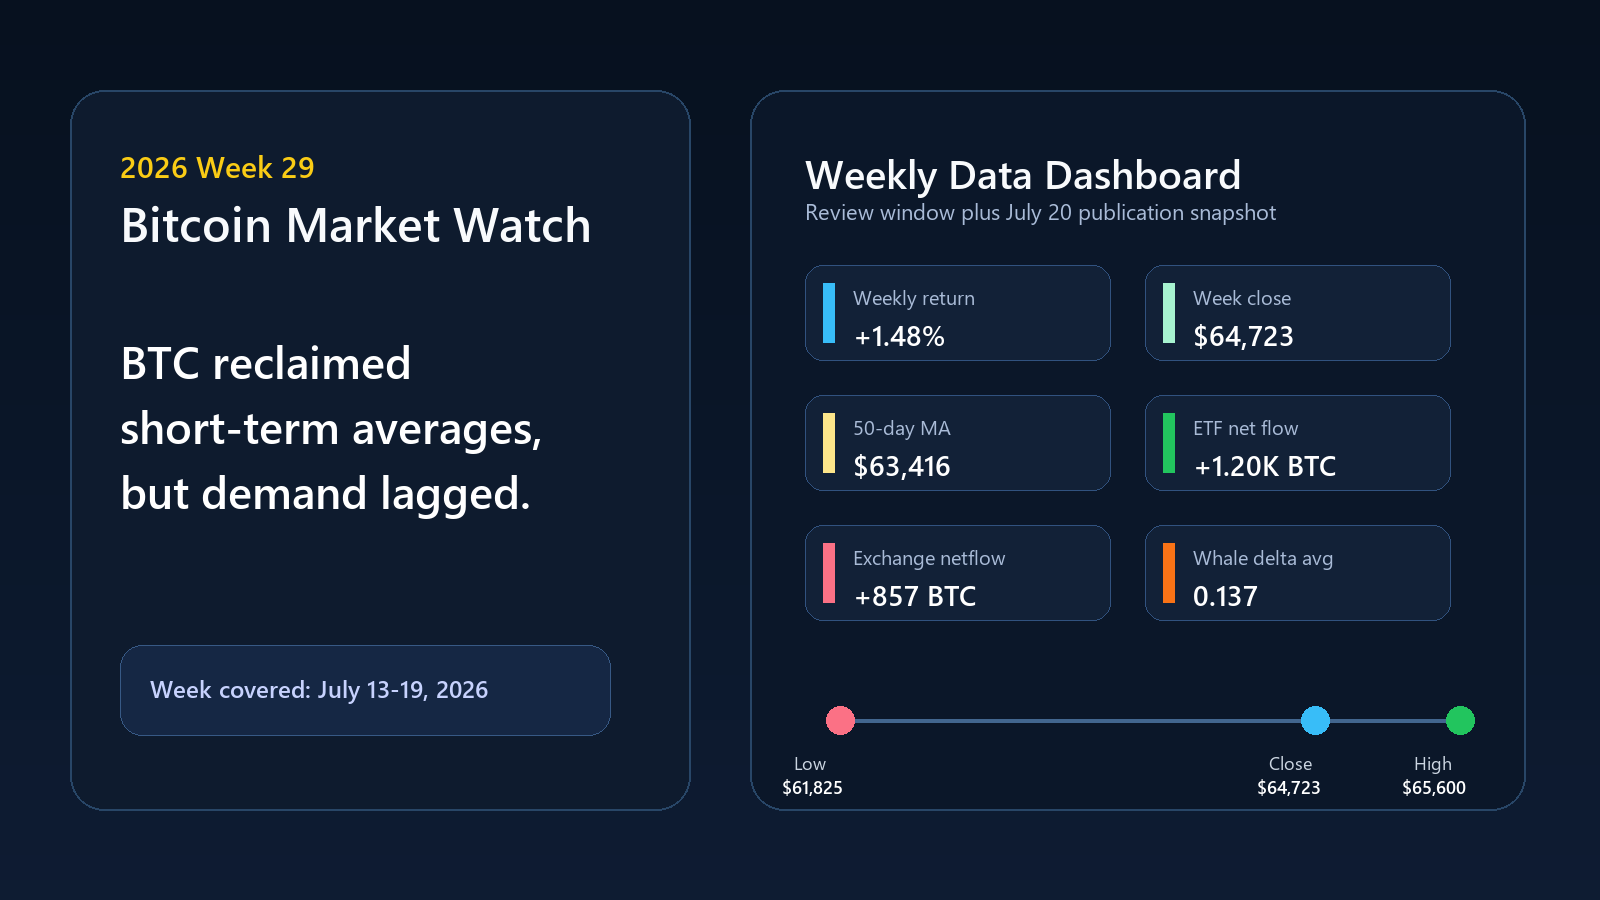
As Bitcoin entered Week 29, the market was still debating whether the low $60,000s were a bottom or just another pause within a fragile range. The answer improved, but it was not fully clear. From July 13 to July 19, BTC opened near $63,780, traded as high as $65,600, pulled back to $61,825, and closed at around $64,723. The 1.48% weekly gain was not aggressive, but it was enough to change the focus of the technical discussion.
The key change was positioning. At the end of Week 28, Bitcoin was still trapped below its 50-day moving average. By the end of Week 29, it had moved above that average. This does not automatically turn the market bullish, but compared with one week earlier, buyers gained a stronger tactical argument. A close above the short-term moving average cluster tells traders that the current range is no longer only about defensive support; the market is also testing whether resistance can turn into a new floor.
The snapshot at publication on July 20 was less exciting than the weekly close. CoinGecko showed BTC near $64,187, with a market capitalization of about $1.29 trillion, while ETH/BTC was near 0.029026. That keeps the message balanced. Bitcoin improved during the review week, but it was still close enough to the range on publication day that traders should avoid treating the reclaim as fully confirmed.
Technical Structure: Improved, but Still Below the Long-Term Trend
The technical table for Week 29 became more constructive. BTC closed above the 20-day moving average at $63,186 and the 50-day moving average at $63,416. This combination matters because it shows that short-term buyers did more than defend a pullback. They pushed price back above the medium-term levels that had capped the market structure in the prior week.
Reclaiming the 50-Day Moving Average Was the Key Improvement
The 50-day moving average is not magical, but it is a useful dividing line between a weak rebound and a more credible repair attempt. A close above it gives bulls a clearer reference point. If BTC can continue trading above this area, the market can view Week 29 as a transition week from range defense toward trend repair.
The next test is follow-through. A single weekly close above the 50-day moving average can also be given back if demand does not confirm it. Traders should watch whether price can hold the low-to-mid $63,000 area, where the 20-day and 50-day moving averages were clustered at the weekly close. If that area is lost quickly, the reclaim will look more like a brief squeeze than a durable shift.
Momentum Improved but Did Not Overheat
The daily RSI was around 54.63 at the end of Week 29, constructive but not overheated. Compared with a late-stage surge, this is a healthier momentum condition because it leaves room for continuation if flows support the move. It also means that if spot demand deteriorates again, the market has not built a strong momentum cushion.
The higher-time-frame backdrop remained more cautious. The monthly RSI was around 43.91, still a weak-to-neutral reading. This keeps the broader framework constrained: Week 29 repaired the short-term chart, but Bitcoin has not yet restored enough long-term momentum to make the 200-day moving average near $73,089 look close.
| Metric | Week 29 / Snapshot Value | Market Interpretation |
|---|---|---|
| Weekly open | $63,780 | Starting point for the July 13–19 review |
| Weekly high | $65,600 | Upper boundary for the week |
| Weekly low | $61,825 | Lower boundary for the week |
| Weekly close | $64,723 | Closed near the top of the weekly range |
| Weekly return | 1.48% | Modest but constructive gain |
| 30-day return | 1.85% | Slightly positive one-month performance |
| Daily RSI | 54.63 | Constructive, not overheated |
| 20-day moving average | $63,186 | Reclaimed |
| 50-day moving average | $63,416 | Reclaimed |
| 200-day moving average | $73,089 | Long-term trend still overhead |
| 30-day realized volatility | 32.37% | Moderate volatility |
Spot Demand Remains the Weak Link
The strongest warning in Week 29 was that spot demand did not confirm the improved chart. The CryptoQuant context provided for this article showed that Bitcoin 30-day spot demand remained in structural contraction, roughly between -78,000 and -170,000 BTC. The range is wide, but direction matters more than false precision: spot demand was still negative.
This matters because a reclaim of moving averages can be driven by several forces. ETF demand may help. Derivatives positioning may help. Liquidation squeezes may also help. But the highest-quality version of a Bitcoin advance usually includes improving spot absorption. Without that, the market is more vulnerable to reversal when leverage cools or ETF flows slow.
Therefore, this week should be read in a differentiated way. Price action improved, but the demand foundation remained incomplete. Bulls can say Bitcoin is repairing because it closed above short-term moving averages and avoided another breakdown. Bears can say the market still depends on flows and positioning while underlying spot demand remains in contraction.
This tension should shape the Week 30 watchlist. If 30-day spot demand readings narrow toward neutral while price holds above the 50-day moving average, the improvement will become easier to trust. If demand expands further into deeper negative territory, the Week 29 reclaim will become more fragile even if the headline price chart still looks orderly.
Flows Helped, but Were Not Clear
Flow data offered support in some areas and confusion in others. CryptoQuant exchange net flow totaled about +857 BTC from July 13 to July 19. That was a small net inflow, not the typical accumulation signal investors usually want to see. It also masked a choppy daily pattern.
The week began with an inflow of +2,766 BTC on July 13 and an inflow of +4,364 BTC on July 14. Then a large outflow of -6,339 BTC appeared on July 15, followed by a small inflow on July 16, near-flat flow on July 17, an outflow on July 18, and another inflow on July 19. In other words, the exchange flow picture did not deliver a clear message. It was more consistent with repositioning than one-way accumulation.
Spot Bitcoin ETFs gave bulls a better argument. CoinGlass showed a large ETF outflow of about -6,660 BTC on July 13, but the rest of the reported ETF trading week improved: +2,910 BTC on July 14, +1,660 BTC on July 15, +1,220 BTC on July 16, and +2,070 BTC on July 17. The net result was an inflow of about +1,200 BTC across the five U.S. ETF trading days shown in the CoinGlass table on July 18.
The ETF recovery helps explain why BTC was able to finish the week higher. However, ETF flows were not enough to erase the spot-demand warning. A healthier structure should show ETF inflows, exchange outflows, and improving spot demand at the same time. Week 29 had ETF recovery and a positive whale delta, but exchange flows were mixed and spot demand remained negative.
Whale and Retail Positioning Stayed Constructive
The CoinGlass whale-versus-retail delta remained positive every day in Week 29. Readings ranged from 0.088 to 0.180, averaging around 0.137. This was a constructive backdrop because it suggested that large traders were still more active than retail accounts as Bitcoin moved back above key short-term moving averages.
The daily pattern also mattered. The strongest readings appeared around July 14 and July 17, while the weakest reading appeared on July 15. This does not point to one clear accumulation wave, but it does show that large participants did not disappear after the ETF outflow on July 13.
For market structure, this is useful but not decisive. A positive whale delta can help explain why price was able to hold even though spot demand remained negative. It may also make the market more sensitive to confirmation signals. If whale delta stays positive while spot demand improves, the recovery logic will strengthen. If whale delta weakens while exchange inflows return, the market may lose one of the supports that helped Week 29 look better than Week 28.
Derivatives and Liquidation Risk
Derivatives remained part of the narrative. In the July 20 publication snapshot, the Binance BTCUSDT funding rate was slightly positive at 0.0058%. Binance BTCUSDT open interest was near 102,124 BTC contracts. As always, that open interest figure is limited to Binance and is not total open interest across the entire market, but it still works as a proxy for leverage.
The July 20 CoinGlass liquidation screenshot showed Binance BTC/USDT perpetuals near $64,185. The map showed visible upside pressure above spot, with notable zones around $65,300, $66,100, and $67,300-$67,700. On the downside, the nearest pressure was roughly around $63,600-$64,000, with larger visible zones around $62,100 and $61,300-$61,900.
This created a clearer two-way map than the weekly close alone. If BTC breaks above the Week 29 high near $65,600, the upper liquidation zones could become relevant quickly. If BTC loses the moving average cluster near the low-to-mid $63,000s, downside long-liquidation pressure will come back into view.
Liquidation maps should not be read as forecasts. They are better used as pressure maps for observing where leverage may react when price starts moving. In Week 29, that distinction mattered because the chart improved, but the demand evidence was not strong enough to remove two-sided risk.
Scenario Map for the Next Bitcoin Market Watch
| Scenario | What Would Confirm It | What Would Weaken It |
|---|---|---|
| Bullish continuation | BTC holds the 20-day and 50-day moving averages near the low-to-mid $63,000s, breaks above the Week 29 high near $65,600, and spot demand improves toward neutral. | Price stalls near $65,600 while spot demand remains structurally negative. |
| Range-bound repair | BTC trades between the 30-day support proxy near $57,800 and the resistance proxy near $65,623, with mixed flows and neutral RSI. | A decisive break of either boundary driven by strong ETFs, exchange flows, and liquidation follow-through. |
| Bearish reversal | BTC loses the moving average cluster near $63,000-$63,500, and exchange inflows expand. | Whale delta stays positive, ETF inflows continue, and the contraction in spot demand narrows. |
Trade Bitcoin With Leverage — Without Giving Up Custody
Decentralized perpetual exchanges have moved well beyond niche status. According to CoinGecko’s 2025 Annual Crypto Report, DEX perpetual volume surged 346% last year to $6.7 trillion, while centralized-exchange open interest fell 20.8% over the same period. Traders are committing significant capital to on-chain derivatives for straightforward reasons: counterparty risk is real, custody failures happen, and censorship resistance matters.
edgeX is a decentralized perpetual futures exchange built for traders who want market access without sacrificing control. Here is what makes it different:
- No KYC, no gates. Connect a wallet and start trading. No identity checks, no account approvals. Wherever you are, getting started is fast.
- True self-custody. edgeX combines off-chain order matching with verifiable on-chain settlement secured by Ethereum. A forced withdrawal mechanism lets your funds be recovered directly from the blockchain, even if the operator stops serving you.
- Deep liquidity, tight spreads. edgeX maintains $10 million in market depth within a one-basis-point spread and delivers less than 0.1 basis point of slippage on trades above $100,000. When Bitcoin moves fast, that precision matters.
- Up to 100x leverage. Whether you are hedging exposure or trading momentum, you can scale positions according to your conviction.
- 140% trading fee rewards. Active traders can earn back more than they pay in fees, reducing the net cost of high-frequency strategies over time.
- Institutional-grade infrastructure. edgeX processes up to 200,000 orders per second, with matching latency below 10 milliseconds, delivering performance comparable to major centralized exchanges without custody trade-offs.
Start trading BTC/USDC perpetual futures on edgeX and put your market view to work.
What to Watch Next Week
The first checkpoint is whether BTC can hold the reclaimed moving average cluster. Week 29 was constructive because BTC closed above the 20-day and 50-day moving averages. A quick loss of that area would weaken the repair narrative.
The second checkpoint is spot demand. The market can rise while 30-day spot demand is negative, but a durable advance becomes more convincing when spot buyers absorb supply rather than leaving the move to ETFs and derivatives.
The third checkpoint is ETF consistency. Week 29 recovered after a large outflow on July 13, but a clearer bullish structure needs repeated positive flows rather than one strong rebound after a weak start.
Finally, the liquidation map leaves traders with clear zones. Upside pressure becomes relevant above the mid-$65,000s, while downside risk returns if BTC falls below the low-to-mid $63,000s.
Frequently Asked Questions
Which week does this Bitcoin Market Watch cover?
This Bitcoin Market Watch covers Week 29 of 2026, meaning July 13 to July 19, 2026. Publication snapshot data, including funding rates, open interest, and liquidation map context, reflect the July 20 workflow.
Was Bitcoin bullish or bearish in Week 29?
Bitcoin was cautiously constructive. BTC rose 1.48% and reclaimed the 20-day and 50-day moving averages, but spot demand remained in structural contraction and exchange net flow was not a clear accumulation signal.
What was the most important warning signal?
The main warning remained spot demand. CryptoQuant context showed that Bitcoin 30-day spot demand was still roughly between -78,000 and -170,000 BTC, meaning the rally was not yet fully confirmed by organic spot absorption.
Did ETFs support Bitcoin in Week 29?
Yes, but the support came after a weak start. CoinGlass showed a large -6,660 BTC outflow on July 13, followed by four positive trading days, bringing the reported July 13–17 ETF week to about +1,200 BTC.
How should traders use liquidation levels?
Use them as a risk map, not a guarantee. The July 20 CoinGlass screenshot showed upside pressure roughly near $65,300, $66,100, and $67,300-$67,700, while downside pressure was visible near $63,600-$64,000, $62,100, and $61,300-$61,900.