Bitcoin vs the S&P 500 in 2026: A Statistical Comparison of Returns, and Correlation
Key Takeaways
- •Over the year to 9 October 2026, the S&P 500 gained 21.30% while Bitcoin lost 29.56%, according to euro-denominated reference fund data from justETF.
- •From August 2011 to August 2026, Bitcoin posted a compound annual growth rate of 87.29% versus 16.85% for the S&P 500, but with a standard deviation of 145.79% against 13.56%.
- •Bitcoin's maximum drawdown over five years was 74.24% compared with 22.60% for the S&P 500, and the S&P 500 outscored Bitcoin on the Sharpe ratio (1.13 versus 0.78) and on return-per-risk in the one-, three- and five-year periods.
- •Newhedge data put the latest 30-day Bitcoin-S&P 500 correlation at 0.68, while a September 2025 analysis placed the 2025 correlation at 0.88, indicating the two assets increasingly move together.
- •On 6 October 2026, Bitcoin traded at $85,571 after slipping below $86,000, while the S&P 500 reached an intraday high of 7,830 amid a new wave of AI enthusiasm for technology stocks.
Bitcoin and the S&P 500 are among the most frequently compared assets for investors. One is a digital asset with a fixed supply; the other tracks the 500 largest companies in the United States. Drawing on data from several sources, this article compares their returns, risk profiles and correlation, with figures running up to October 2026. Because the sources apply different dates and currencies, small gaps appear between some tables.
The comparison uses euro-denominated reference funds rather than a direct comparison of the spot price of Bitcoin with the index. That means the figures can also reflect differences in product launch dates, fund structure and currency conversion, in addition to the performance of the underlying assets.
Past results do not predict future ones. This article is for information only and is not financial advice.
Bitcoin vs S&P 500: Key Statistics at a Glance
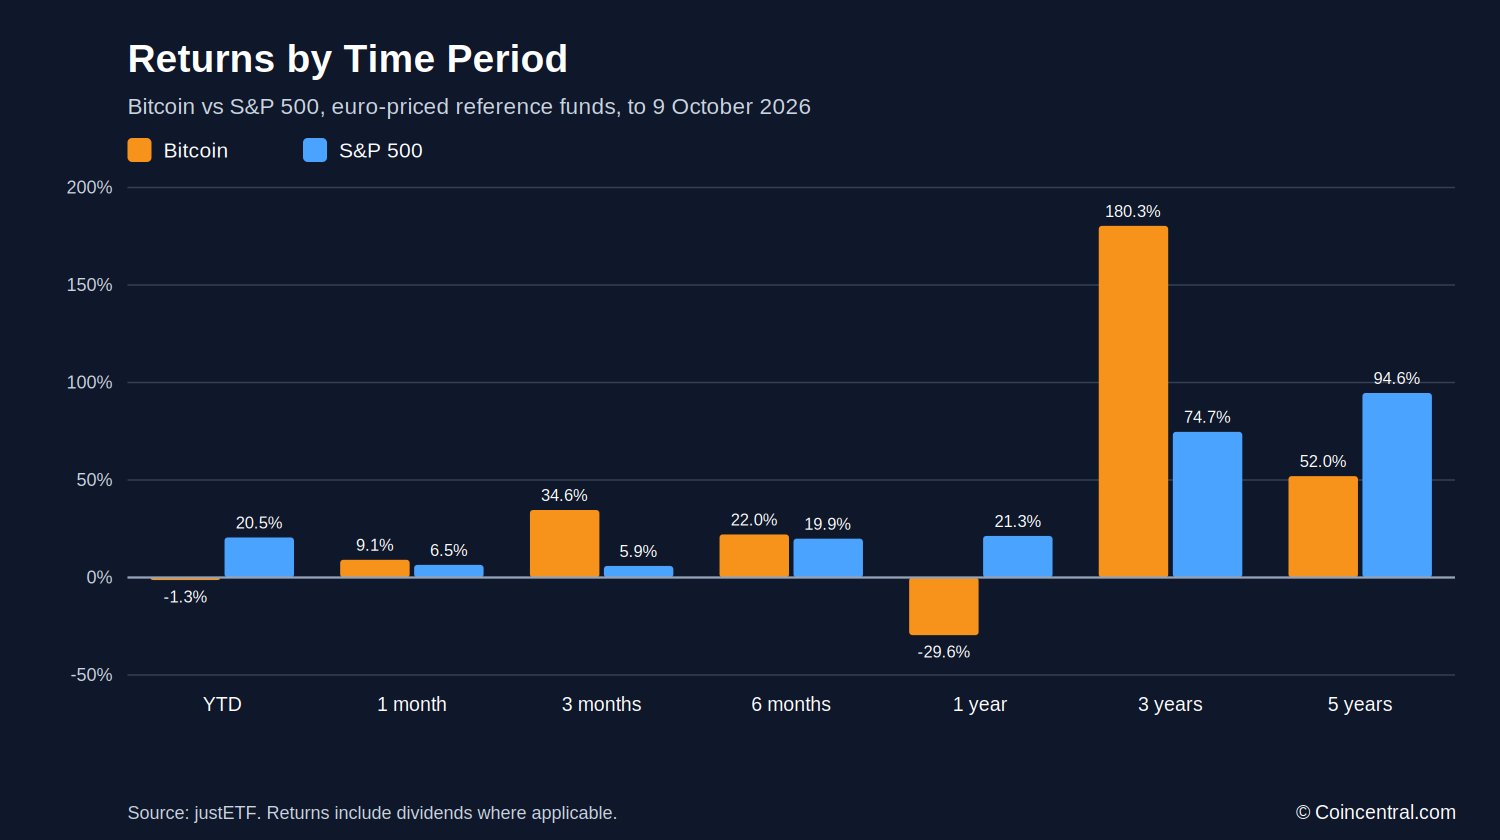
In the year to 9 October 2026, the S&P 500 gained 21.30% while Bitcoin lost 29.56%. These figures come from justETF and are based on two euro-denominated reference funds: the iShares Core S&P 500 UCITS ETF for equities and CoinShares Physical Bitcoin for the cryptocurrency.
The picture shifts across other time frames. Bitcoin gained 34.62% over three months and 180.31% over three years, against 5.90% and 74.73% for the S&P 500 over the same periods.
Over five years the ranking reverses again: the S&P 500 fund returned 94.59% versus 51.97% for the Bitcoin fund. Year to date, the S&P 500 is up 20.52% while Bitcoin is down 1.28%. In the past month, Bitcoin led with a 9.07% gain against 6.45% for the S&P 500, and six-month returns were close at 22.04% and 19.89%.
Since the start of each fund, the S&P 500 fund is up 876.42% and the Bitcoin fund up 129.46%. The two products did not launch on the same date, so these totals are not a like-for-like comparison; matched time frames give a fairer view. justETF lists both as long-only, with the S&P 500 fund covering US equities and the Bitcoin fund tracking the value of the cryptocurrency.
Long-Term Growth: Compound Returns and Averages
A longer view uses data from August 2011 to August 2026, priced in euros. Over that span, Bitcoin posted a compound annual growth rate of 87.29%, while the S&P 500 posted 16.85%.
Bitcoin's annual swings were far wider. Its standard deviation was 145.79%, compared with 13.56% for the S&P 500. Standard deviation measures how far returns move away from their average.
The Sharpe ratio adjusts return for risk: Bitcoin scored 0.78 and the S&P 500 scored 1.13, with a higher number indicating more return per unit of risk taken.
Average annual returns change considerably with the time frame. Over the last 10 years, Bitcoin averaged 63.0% a year and the S&P 500 averaged 14.9%. Over the last five years, the S&P 500 was ahead at 13.2% against 11.2%.
Total returns follow the same pattern. Over 10 years, Bitcoin rose 13,115.5% in this data set while the S&P 500 rose 301.2%. Over five years, the S&P 500 rose 86.3% and Bitcoin rose 70.0%.
A separate article from September 2025 put the 10-year gains at 49,944.7% for Bitcoin and 235.4% for the S&P 500. Different end dates and data sets lead to different totals, showing how strongly the start and end points shape the result. The five-year numbers illustrate the start-date effect: Bitcoin's average of 11.2% a year sits far below its 10-year average of 63.0%, whereas the S&P 500 moved much less between the two periods, from 14.9% to 13.2%.
Annual Returns From 2012 to 2025
Within this data, Bitcoin recorded both the best and worst calendar years. It rose 5,189.37% in 2013 and 1,162.50% in 2017, and fell 72.13% in 2018 and 62.02% in 2022.
The S&P 500 moved in a narrower range. Its best year was 2021 at 39.44% and its worst was 2022 at a loss of 13.04%, and it posted a gain in 13 of the 14 years shown.
Bitcoin had four down years across the 14 shown: 2014, 2018, 2022 and 2025. The first three were each followed by a gain the next year. The 2025 loss was 17.16%.
The two assets moved apart in some years. In 2018, Bitcoin lost 72.13% while the S&P 500 was flat at 0.15%. In 2020, Bitcoin gained 270.28% against the S&P 500's 8.39%. Some years saw both assets rise strongly: in 2021, Bitcoin gained 72.70% and the S&P 500 39.44%, and in 2019 the pattern was similar at 97.82% and 34.01%. Both fell together in 2022, with Bitcoin down 62.02% and the S&P 500 down 13.04%. The 2025 figures differ slightly between the sources used for this article, so readers should check which data set they are reading.
The count of up years also differs. Bitcoin had gains in 10 of the 14 years and the S&P 500 in 13 of 14. Bitcoin's gains, when they came, were often much larger than those of the S&P 500.
Volatility and Drawdowns
Volatility measures how much prices move up and down. Over one year, Bitcoin's volatility was 40.44% in euro terms and the S&P 500's was 12.43%. The gap holds over longer periods: over three years, Bitcoin's volatility was 44.16% against 15.47% for the S&P 500, and over five years it was 48.61% against 17.48%.
Bitcoin's volatility rose as the window grew longer, moving from 40.44% to 44.16% to 48.61% as the period extended from one to five years. The S&P 500 rose more slowly, from 12.43% to 17.48%.
A drawdown measures the fall from a peak to a low point. Over the past year, the S&P 500 fund had a maximum drawdown of 7.49%, while the Bitcoin fund fell 50.94% from peak to low. Over five years, the S&P 500 drawdown was 22.60% and the Bitcoin drawdown 74.24%. Since the start of each fund, the worst fall for the S&P 500 fund is 33.71%.
A 74.24% fall means an investor would need a gain of about 288% to return to the earlier peak. This is one reason drawdowns matter as much as returns. Many investors feel drawdowns more than averages: a fall of 50% in a single year is hard to hold through for some people, while the S&P 500 fund's one-year fall of 7.49% was far milder.
The September 2025 article gives wider ranges for long-run volatility. It puts Bitcoin's standard deviation at 70% to 90% and the S&P 500's at 15% to 20%. It also says the S&P 500 briefly showed higher volatility than Bitcoin during US tariff news in 2025.
Return Per Risk: How Much Reward for the Risk Taken
Return per risk divides a fund's return by its volatility, showing how much return an investor received for each unit of risk. justETF reports the figure for three periods.
Over one year, the S&P 500 scored 1.71 and Bitcoin scored -0.73, with the negative number reflecting Bitcoin's 29.56% loss over that period. Over three years, the S&P 500 scored 1.32 and Bitcoin 0.93; Bitcoin's three-year gain of 180.31% was large, but its 44.16% volatility lowered the score. Over five years, the S&P 500 scored 0.81 and Bitcoin 0.18. The S&P 500 led in all three periods on this measure.
The long-run Sharpe ratios agree. From 2011 to 2026, the S&P 500 scored 1.13 and Bitcoin 0.78. Bitcoin's raw returns were higher, but its risk was higher too.
These ratios depend on the dates chosen, and a different start point would change the numbers. Investors often check several periods before drawing conclusions.
Return per risk is not a full picture of an investment. It treats up and down moves the same way, so an investor who cares most about losses may prefer to read the drawdown figures.
Bitcoin and S&P 500 Correlation
Correlation shows how closely two assets move together. It runs from -1 to 1: a value of 1 means they move in the same direction and -1 means they move in opposite directions. Real assets rarely reach either end, and values usually sit somewhere in between.
Newhedge data shows a 30-day correlation of 0.68 at the latest reading. That snapshot lists the S&P 500 at $7,811.54 and Bitcoin at $83,673.69. Newhedge says the 30-day figure has often topped 70% over the past five years.
The link has not always been strong. In early 2020, before the Covid-19 pandemic, the two were negatively correlated. During Bitcoin's 2019 rise from about $3,000 to $12,000, the correlation turned sharply negative. The pandemic then pulled the two closer together, with Bitcoin and stocks moving in step as central bank policy and the economic shock drove markets.
The September 2025 article puts the 2025 correlation at 0.88, saying both assets now react in a similar way to interest rates, inflation and market mood. Different methods give different readings, so the 0.68 and 0.88 figures should not be treated as the same measure.
Newhedge says that when correlation is high, Bitcoin acts more like a risk asset, and when it falls, Bitcoin's own factors—such as its fixed supply, adoption and halving events—have more influence. That is an analyst view and not a certainty.
Correlation is also not fixed. It changes with market conditions and with the window used to measure it. A 30-day reading can swing quickly, while a one-year reading moves more slowly.
What Is Inside the S&P 500
The S&P 500 tracks the 500 largest US stocks. The iShares fund used by justETF holds 503 positions, while the index itself has 500 holdings.
The top 10 holdings make up 37.76% of the fund. NVIDIA is the largest at 8.07%, followed by Apple at 7.03% and Microsoft at 5.69%.
Technology is the largest sector at 45.23%. Finance follows at 13.62%, healthcare at 9.09% and consumer non-cyclicals at 8.88%, with all other sectors together accounting for 23.18%. By country, 97.48% of the fund is in the United States, with Ireland at 1.15% and other countries at 1.37%.
Bitcoin has no holdings, sectors or company earnings; the CoinShares fund tracks the price of the coin. Funds that track the S&P 500 pay a dividend yield of 1.5% to 2% a year, while Bitcoin pays none.
Because of these weights, a few large technology firms have a large effect on the index. Dow Jones reported that a new wave of enthusiasm about AI pushed tech stocks higher in early October 2026. Concentration in large technology firms is one risk to watch: the top three holdings alone—NVIDIA, Apple and Microsoft—add up to 20.79% of the fund, while Broadcom, Alphabet C, Meta, Micron and Tesla each hold between 1.56% and 2.65%.
What Drives Each Asset and What a Mixed Portfolio Looked Like
Bitcoin's supply is capped at 21 million coins, a limit built into its code. A halving takes place about every four years and cuts miner rewards in half. The September 2025 article says past halvings were followed by price rallies and links this to slower growth in new supply, though past patterns do not guarantee the same result.
The S&P 500 depends on company earnings, US economic growth and wider economic data. Steady flows from pension funds and ETFs also support the index, and its long-term average return is about 10% a year, according to the article.
Some analysts argue for mixing the two. The September 2025 article says a portfolio of 90% S&P 500 and 10% Bitcoin returned 495% to 700% over the past decade, against 235.4% for the S&P 500 alone. This result depends on Bitcoin's strong 10-year run; a mix over a weaker period would look different, and Bitcoin's drawdowns of more than 50% would also affect any portfolio that holds it.
Institutions also hold Bitcoin. The article says professional investors hold more than a quarter of the $27.4 billion in US Bitcoin ETFs, and companies such as Strategy keep Bitcoin in their reserves.
Risks differ too. Bitcoin faces regulatory uncertainty, technology risk and large price swings; in Europe, the MiCA framework has added oversight and investor protection. The S&P 500 faces recession risk and inflation. The article also says stocks and bonds have become more correlated, which can reduce the diversifying effect of bonds in a downturn.
Bitcoin's role as a hedge is debated. The article describes it as a hedge against long-term loss in the value of the dollar and other currencies, yet the data here shows it also fell sharply when stocks fell, as in 2022.
The Latest Market Picture in October 2026
On 6 October 2026, Bitcoin fell below $86,000. It topped out near $86,600 in late morning trading and later traded at $85,571, down 0.3%. Dow Jones reported that Bitcoin was up 2% since the start of October.
The S&P 500 reached an intraday high of 7,830 and was on pace to settle above its record from August, lifted by a new wave of AI enthusiasm in tech stocks. Bitcoin stayed in a range between $84,000 and $87,000.
Seasonality is getting attention. October has been positive for Bitcoin in 10 of the past 13 years, though the fourth quarter of 2025 ended a six-year winning streak for that quarter. Analysts at 21shares said a close above $88,000 in October would confirm a trend change and make $100,000 possible by year end, while a slide to $81,000 could lead to $71,300. Neither outcome is certain.
The Federal Reserve meets on 27 and 28 October. Last month's meeting led to the first rate rise in three years, and expectations for another rise this month have been trimmed.
Longer-term forecasts vary widely. The September 2025 article says analysts expect Bitcoin could range from $160,000 to $900,000 by 2030, with some scenarios as high as $2 million. For the S&P 500, the article points to a long-term average of about 10% a year.
Short-term moves are hard to predict. The 21shares scenarios give a range of $71,300 to $100,000 from a starting price of $85,571—a drop of about 17% at the low end and a rise of 17% at the high end.
What the Statistics Show
The data shows two different assets. Bitcoin has produced much larger gains over long periods, but with far larger losses, while the S&P 500 has delivered steadier returns with smaller drops. Over the past year, the S&P 500 did better, with a 21.30% gain against a 29.56% loss for Bitcoin. Over three years, Bitcoin did better, and over five years the S&P 500 is ahead.
Several measures point the same way for the S&P 500: a higher Sharpe ratio, a higher return-per-risk score in all three periods and much smaller drawdowns. Bitcoin had far higher returns over 10 years and over three years.
Correlation has risen in recent years, so the two do not always move apart. Time frame, currency and data source all change the numbers, and readers should check these details before they compare figures.
Sources
- S&P 500 vs Bitcoin in comparison (justETF)
- Bitcoin vs S&P 500: historical performance
- Bitcoin vs. S&P 500 (September 18, 2025)
- Bitcoin vs. U.S. Equities Correlation (S&P 500) (Newhedge)
- Bitcoin Slips While S&P 500 Finds New High (Dow Jones, 6 October 2026)
Original article: Bitcoin vs S&P 500 Statistics 2026: Returns, Risk and Correlation (CoinCentral)

