Bitcoin vs Gold 2026: Key Statistics Show How the Two Stores of Value Compare
Key Takeaways
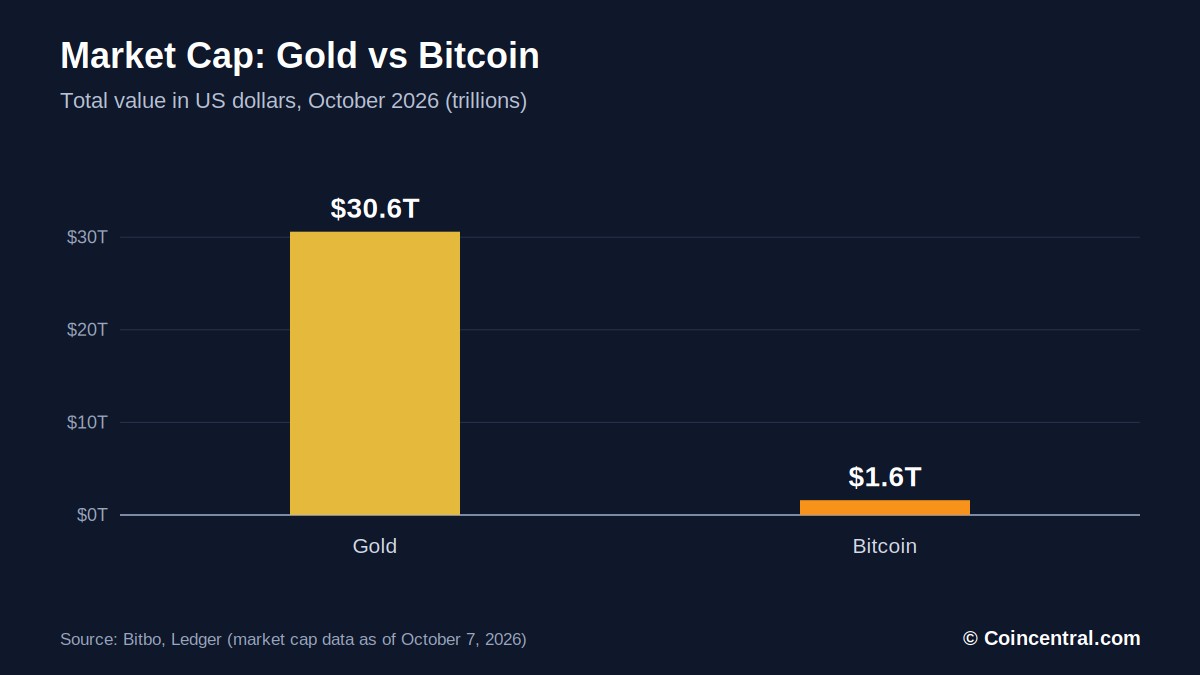
- •As of October 7, 2026, Bitcoin's market capitalization of about $1.6 trillion represented roughly 5.4% of gold's approximately $30.6 trillion market cap.
- •The Bitcoin-to-gold ratio stood at about 20.12 ounces on October 7, 2026, roughly 50% below its December 2024 peak of 40.1 ounces.
- •Bitcoin returned approximately 16,350% over the past ten years, compared with about 272% for gold, but with significantly deeper price swings.
- •Bitcoin's annual supply growth fell to about 0.8% after the April 2024 halving, below gold's estimated 1.6% to 3% yearly supply increase.
- •Bitcoin mining consumes an estimated 204.44 TWh of electricity per year, about 55% more than the roughly 132 TWh used for gold mining.
Bitcoin and gold are routinely placed side by side as stores of value. Both are scarce, and neither is issued or controlled by a central bank. They differ, however, in age, price volatility, market size, and how investors hold them. The numbers behind that comparison, drawn mainly from early October 2026, show both the overlap and the gap between the two assets.
This analysis uses data from Bitbo, Ledger, FXStreet, and other pages, with most prices taken from early October 2026. Because the figures come from different sources on different dates, some totals vary slightly. Those variations are flagged where they occur.
Key Bitcoin vs Gold Statistics
- One bitcoin was worth about 20.12 ounces of gold on October 7, 2026.
- Bitcoin's market cap stood at about 5.4% of gold's.
- The BTC/gold ratio sits roughly 50% below its December 2024 high of 40.1 ounces.
- Over ten years, Bitcoin returned about 16,350%, while gold returned about 272%.
- Bitcoin's supply grows about 0.8% a year, versus 1.6% to 3% for gold.
- Bitcoin mining consumes about 204.44 TWh a year, and gold mining about 132 TWh.
Prices and Market Size
On October 7, 2026, Bitcoin changed hands at $83,373.46, and gold traded at $4,142.80 per ounce. A separate reading from the same window put Bitcoin at $83,229 and gold at $4,191.
Gold's market capitalization was roughly $30.6 trillion in the latest data, while Bitcoin's was about $1.6 trillion — making Bitcoin about 5.4% the size of gold. Other sources report slightly different totals: Ledger lists gold at about $32 trillion and Bitcoin at about $1.55 trillion, while an earlier Bitbo reading showed gold at $29.1 trillion and Bitcoin at $1.67 trillion, or 5.7%.
Market capitalization is price multiplied by supply. For Bitcoin, that means the coins in circulation. For gold, it relies on the World Gold Council's estimate of above-ground stock, which Ledger places at about 220,000 tonnes.
The size gap has practical consequences. A smaller market can move further on the same amount of money, which is one reason Bitcoin's price swings tend to exceed gold's.
Gold has functioned as money for thousands of years. Bitcoin launched in 2009 under the pseudonym Satoshi Nakamoto, whose true identity remains unknown. Its whitepaper described a peer-to-peer form of electronic cash that requires no financial intermediary.
The Bitcoin-to-Gold Ratio
The ratio expresses how many ounces of gold are needed to buy one bitcoin — Bitcoin's price divided by gold's price. A rising ratio means Bitcoin is outperforming gold; a falling ratio means gold is ahead.
On October 7, 2026, the ratio stood at 20.12 ounces. An earlier Bitbo reading showed 19.86 ounces, equivalent to 563.04 grams of gold per bitcoin.
The ratio peaked at 40.1 ounces in December 2024, and the earlier reading was 50.5% below that. Put plainly one bitcoin now buys about half as much gold as it did at the peak.
Bitbo's ratio chart marks Bitcoin's price peaks in 2011, 2013, 2017, and 2021, and uses a logarithmic scale to accommodate the steepness of Bitcoin's advances. Some investors prefer to measure Bitcoin in gold rather than dollars, arguing that dollars are printed without a fixed limit while gold's supply grows slowly. The underlying data comes from the Coin Metrics CMBI Bitcoin Benchmark, with gold prices supplied by OnlyGold and Yahoo Finance.
Bitbo also maintains a second chart comparing the percentage price change of both assets over time. Bitcoin's gains have been larger than gold's — and its price drops have also been deeper.
Supply and Inflation Rates
Bitcoin's supply is fixed in code. The protocol caps the total at 21 million coins, and about 20 million had been mined as of 2026. A portion of those coins is lost for good, through misplaced private keys or damaged storage devices.
New coins enter circulation on a set schedule. Roughly every four years, or every 210,000 blocks, the reward paid to miners is cut in half. The most recent halving took place in April 2024, with the next estimated for April 15, 2028. Miners compete to solve a mathematical problem; the first to solve it adds a block of transactions and earns the block subsidy plus fees — work that secures the network and verifies payments.
After the 2024 halving, Bitcoin's annual supply growth fell from about 1.8% to about 0.8%. Ledger projects that new coin issuance will cease around the year 2140, when the growth rate reaches zero.
Gold has no fixed cap. Above-ground supply stands at about 220,000 tonnes, and mines add 3,600 to 3,700 tonnes a year, translating into annual supply growth of roughly 1.6% to 3%. Ledger attributes the slow pace to several factors: large new deposits are discovered less often than in the 1990s, and output has leveled off, prompting speculation about whether the world is nearing "peak gold."
Ledger estimates that 50,000 to 64,000 tonnes of gold remain unmined, though the exact amount is unknown. It also reports that gold demand outran supply in 2026, driven by central bank buying, investor interest, and jewelry demand. A major new discovery or a mining breakthrough could alter that supply picture. That uncertainty cuts both ways: Bitcoin's new supply arrives on a timetable written into its code, while the pace of future gold supply depends on exploration outcomes that cannot be planned.
Returns, Volatility, and Risk
Bitcoin has delivered far larger returns than gold — along with far larger swings. Ledger reports that Bitcoin returned about 16,350% over the last ten years, compared with about 272% for gold over the same period. On those percentages, $1,000 invested ten years ago would be worth about $164,500 in Bitcoin and about $3,720 in gold. Past results do not guarantee future results.
Risk is where the two assets diverge most. One source notes that Bitcoin's price can move more than 10% in a single day, and its price has halved from peak to trough several times even while trending higher over the long run. Gold is steadier, typically moving in smaller steps in response to economic conditions. A January 2025 article notes that gold's average return has exceeded 10% over the past two decades.
The Sharpe ratio, which measures return per unit of risk (higher is better), also favors Bitcoin by a slim margin. Ledger says Bitcoin's Sharpe ratio has averaged between 0.70 and 0.78, while gold's has run between 0.60 and 0.61. On that basis, Bitcoin has performed slightly better after adjusting for risk. Gold, though, has been the calmer asset during downturns. Ledger notes that Bitcoin has recovered from every drop so far, but there is no guarantee it always will.
Gold tends to do well during geopolitical tension, economic downturns, and periods of inflation. Bitcoin's results in such episodes are mixed; the January 2025 article says they depend on adoption trends, regulation, investor mood, and even social media comments from influential people.
Both assets are liquid. Gold benefits from established markets and trading systems, while Bitcoin trades easily on major exchanges, though liquidity can vary with market conditions and location.
Correlation Between Bitcoin and Gold
Correlation measures how closely two assets move together: a reading of +1 indicates same-direction movement, 0 indicates no link, and -1 indicates opposite movement.
Bitbo's one-year rolling correlation of daily returns between Bitcoin and gold was +0.35 in an earlier reading, pointing to a mild positive link. A second page showed -0.26 over the trailing 12 months as of October 7, 2026. The readings differ because they use different dates and methods, but both sit close to zero relative to the +1/-1 bounds, suggesting the link between the two assets has been weak.
Bitbo also offers a 30-day window, which reacts faster, alongside the one-year view that captures the longer trend; short windows can swing considerably from one month to the next.
Bitcoin's link to stocks also shifts over time, according to the January 2025 article. It often behaves like a risk-on asset when markets rise and has split from stocks during periods of extreme stress. Gold generally maintains a low, and often negative, correlation with stocks.
In his book Principles, Ray Dalio called diversification the "Holy Grail of Investing," writing that fifteen to twenty uncorrelated return streams could cut risk sharply without reducing expected returns. Low correlation is one reason some investors hold both assets. Still, a weak or negative reading does not promise the two assets will offset each other in a crash — correlations change over time, and past readings may not hold in future markets.
Energy Use and Environmental Impact
Both assets carry an environmental cost. Ledger estimates that Bitcoin's proof-of-work system uses about 204.44 TWh of electricity a year, while gold mining uses an estimated 132 TWh. Mining a single bitcoin takes about 1,238,322 kWh of electricity, according to the same source.
Ledger also says Bitcoin's carbon output is higher per unit because many mining operations rely on fossil fuels. By these estimates, Bitcoin's yearly energy use is about 55% higher than gold's, and its CO2 output per bitcoin is about 22 times the figure for an equal value of gold. Ledger puts the CO2 from minting one bitcoin at about 691 tonnes, versus about 31 tonnes for mining the same dollar value of gold. Ledger sells Bitcoin hardware wallets, so readers may want to compare numbers against other research.
Gold mining carries its own costs. Large mines cause deforestation, soil erosion, and habitat loss; cyanide and mercury used in processing can leak into rivers and groundwater; and producing a single ounce of gold takes thousands of litres of water. These effects are physical and local, whereas Bitcoin's footprint is mainly tied to power consumption.
Portfolio Views and How Each Asset Is Held
Ray Dalio, founder of Bridgewater Associates, wrote an article titled "How Countries Go Broke," in which he said government debt is at an inflection point and many economies may face a "debt and currency devaluation adjustment" in less than three years. He argued that non-yielding assets such as gold and Bitcoin could perform well in that environment, and his preferred allocation is 10% to 15% in gold and 1% in Bitcoin. On the All-In Podcast in March, he said, "There is only one Gold," calling it second-largest reserve currency held by central banks.
Dalio also advises spreading money across asset classes and countries with strong income statements and balance sheets, and urges less exposure to debt assets such as bonds.
The January 2025 article frames gold as the pick for conservative investors and Bitcoin as a draw for those seeking high risk and high reward. Both can serve as hedges against inflation, and neither is controlled by a central authority.
Holding methods differ as well. Physical gold usually involves vault fees, insurance, and some counterparty risk. Gold ETFs remove storage concerns, but the holder owns a claim on gold rather than the metal itself. Bitcoin is controlled by private keys: if an exchange holds the keys, the owner has a claim rather than direct ownership, while cold storage keeps keys offline, and a hardware wallet can be backed up with a 24-word recovery phrase. Ledger says physical gold can be seized under some legal frameworks, while Bitcoin in cold storage cannot be taken without the keys. Critics counter that Bitcoin's on-ramps can be restricted and that it faces legal and compliance risks in some jurisdictions.
Price Levels and Market Drivers in October 2026
Both assets fell in early October. Bitcoin traded near $83,000 after a three-day sell-off, and attempts to break above $87,200 failed. FXStreet attributes the decline to leveraged long liquidations and geopolitical pressure. Gold tested support near $4,100.
Attention turned to the Federal Reserve's September meeting minutes. The Fed raised rates by 25 basis points to a range of 3.75% to 4.00% — its first hike since 2023 — in a unanimous vote. Softer inflation data after that meeting cut the odds of another hike in October. Talks to end the US-Iran war also remain uncertain, which has kept oil and energy prices in focus. Those two threads — the Fed's rate path and the unresolved US-Iran talks — form the macro backdrop for both assets in this window.
Short-term price moves are common for both assets and represent a snapshot of one week, not a trend. Readers should check live prices before drawing conclusions.
FXStreet's technical review places Bitcoin at $83,173, with its RSI at 52, near neutral. The SuperTrend sits at $79,665, the 100-day EMA at $75,710, and the 200-day EMA at $75,130. The MACD is below zero, hinting that buying pressure is easing. FXStreet says a close below the band near $79,564 to $79,664 would show the bullish phase losing momentum, potentially opening a move toward the mid-$75,000s; holding above it keeps the path tilted upward.
Gold trades below its 50-day EMA at $4,285, its 200-day EMA at $4,305, and its 100-day EMA at $4,326. Its SuperTrend sits at $4,380, and its RSI is 36, just above oversold territory. To ease its bearish tone, gold would need to reclaim a downward trendline near $4,449; if $4,100 support breaks, investors may look toward $4,000. These are one analyst's technical readings, not forecasts — levels change daily and should be checked against current data.
What the Statistics Show
This analysis draws on several sources, each using its own dates and methods, which is why market caps, correlation readings, and ratios differ slightly from page to page. The direction of the data is consistent even where exact figures are not.
Gold is the larger and steadier asset, with a market cap near $30 trillion and supply growth of 1.6% to 3% a year. Bitcoin is much smaller, at about 5.4% of gold's size, with slower supply growth of about 0.8%. Bitcoin has returned far more over ten years, but with much sharper price swings. The BTC/gold ratio has fallen by about half since December 2024, and the correlation between the two assets is close to zero. Energy use is high for both, and the per-coin carbon figures differ widely.
Investors weigh these numbers against their own risk tolerance, time frame, and view of the economy. Some of these numbers are also scheduled to change on their own — Bitcoin's issuance rate steps down again at the estimated April 2028 halving — while the ratio, the correlation, and the market-cap gap move with prices, and gold's supply picture could shift with the next major discovery.
Sources
- BTC vs Gold Chart Price and Ratio (Bitbo)
- Bitcoin vs Gold: Ratio, Correlation and Market Cap Data (Chart data page, October 7, 2026)
- Bitcoin v Gold, January 2025 (Invest category article)
- Bitcoin Vs Gold: Which Is a Better Store of Value in 2026? (Ledger, May 5, 2026)
- Bitcoin vs Gold: BTC and XAU fall, but Ray Dalio still prefers Gold (FXStreet, by John Isige)
This article originally appeared on CoinCentral.

