Bitcoin May Have Found a Floor, But the $83 Billion Damage to Treasury Companies Remains
Key Takeaways
- •Bitcoin's recent low of $59,572 came within about 2.3% of Timmer's power-law support at $58,237, and he says the correction has lasted long enough to complete a mild four-year-cycle winter.
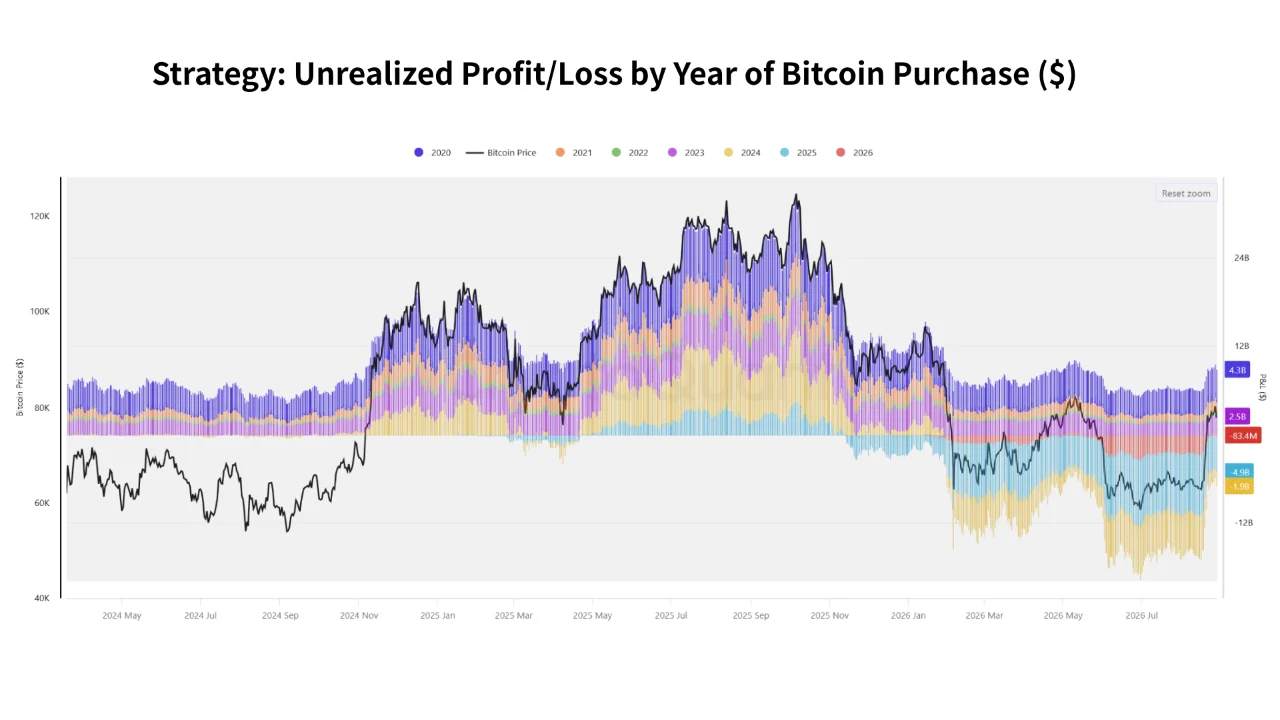
- •CryptoQuant data show Strategy's 2020 and 2023 Bitcoin purchases carry roughly $4.3 billion and $2.5 billion in unrealized gains, while 2024, 2025 and 2026 cohorts are underwater by approximately $1.9 billion, $4.9 billion and $83.4 million respectively.
- •A Financial Times analysis of 50 corporate Bitcoin holders found combined market capitalization fell about 55% from $150 billion in July 2025 to $67 billion in August 2026, versus a roughly 30% Bitcoin decline.
- •Shares of 43 of the 50 analyzed treasury companies traded below their pre-pivot prices, and 35 had lost at least half their value; Strategy's market cap fell roughly $79 billion from its peak.
- •The 50-company group became a net Bitcoin seller for the first time in July 2026, disposing of about 2,500 more BTC than it acquired, with Strategy driving much of the reversal.
Bitcoin Held Fidelity’s Power-Law Floor
Jurrien Timmer, Fidelity’s director of global macro, said Bitcoin had held the lower boundary of his power-law curve and had spent enough time correcting to satisfy what he calls a mild four-year-cycle winter.
His chart, using weekly data through August 23, marks Bitcoin’s recent low at $59,572 against power-law support at $58,237 — within roughly 2.3% of the model line. A separate 16% reading at the chart’s right edge reflects Bitcoin’s distance above support by August 23, after price had moved away from the trough.
Bitcoin has held the floor of its power law curve and has now corrected long enough to satisfy the time element of its mild 4-year cycle winter. pic.twitter.com/M6QHRWDfA8
— Jurrien Timmer (@TimmerFidelity) August 28, 2026 (X post)
Timmer’s model places Bitcoin’s long-term price history inside a rising curve whose growth rate slows over time. Previous bear-market lows formed near its lower boundary, including the 2015, 2018 and 2022 bottoms. This year’s decline tested the same region.
The Model Identifies a Zone, Not a Reversal
Reaching that area supports the argument that the correction is mature. A new bull market would still require buyers to build on the recovery rather than simply defend one historical line. In Fidelity’s official explanation of the framework, Timmer warns that adoption curves can eventually break. The model organizes Bitcoin’s price history; it cannot make the previous pattern repeat.
Coindoo previously examined Bitcoin’s approach toward power-law support. The latest reading adds the missing test: Bitcoin reached the area and recovered without closing decisively through the model floor.
That recovery improves one input on a corporate balance sheet — the market value of its Bitcoin. It does not erase the very different prices companies paid to build their reserves.
Strategy’s Average Cost Hides a Divided Reserve
A CryptoQuant chart from August 29 separates Strategy’s unrealized Bitcoin profit and loss by purchase year, revealing the timing risk concealed by a single blended cost basis. The company, formerly known as MicroStrategy, began converting its corporate cash into Bitcoin in August 2020 and later became the template that dozens of other treasury companies copied.
At the chart’s latest reading, Bitcoin acquired in 2020 carried approximately $4.3 billion in unrealized profit, and the 2023 cohort contributed another $2.5 billion. Those gains partially offset losses attached to later, more expensive purchases:
- 2024 purchases: approximately $1.9 billion underwater.
- 2025 purchases: approximately $4.9 billion underwater.
- 2026 purchases: approximately $83.4 million underwater.
The data does not display final values for every purchase-year cohort, so the visible figures should not be added together to calculate Strategy’s total unrealized result. They are also a moving dataset: every change in Bitcoin’s price alters the gains and losses. Strategy’s official Bitcoin ledger provides the underlying transaction history, including acquisition dates, amounts and purchase costs.
The Chart Leaves Financing Costs Outside the Frame
CryptoQuant compares the market value of each purchase cohort with its acquisition cost. Preferred-stock dividends, debt interest, issuance expenses and common-share dilution sit outside that calculation. An unrealized loss also creates no automatic requirement to sell Bitcoin.
Strategy shareholders own the company’s entire capital structure, not an isolated pool of BTC. Coindoo’s earlier look at Strategy’s reserve at different Bitcoin prices showed how quickly the paper cushion can change while its corporate obligations remain.
An improving reserve does not guarantee an equivalent recovery for shareholders. Public-company valuations contain financing and dilution risks that the Bitcoin price alone cannot repair.
Treasury Stocks Fell Further Than Bitcoin
A Financial Times analysis examined 50 major corporate Bitcoin holders that had recently made accumulation central to their strategy, excluding miners, exchanges and businesses holding BTC as part of established operations.
Within that sample, combined market capitalization fell from $150 billion in July 2025 to $67 billion in August 2026 — a decline of roughly $83 billion, or approximately 55%. Over the latest 12 months alone, the group dropped from $124 billion to $67 billion, while Bitcoin declined about 30% over the same period.
Shares in 43 of the 50 companies traded below where they stood before the businesses announced their Bitcoin pivots, and 35 had lost at least half their value.
Strategy Dominates the Reported Decline
Strategy’s market capitalization fell by roughly $79 billion from its own peak, accounting for most of the damage identified by the FT. Because the calculation does not necessarily use the same starting date as the group’s $83 billion decline, the two figures cannot establish Strategy’s exact percentage of the total.
That concentration means the headline number does not describe 50 equally severe collapses. The breadth figures — 43 stocks below their pre-pivot prices and 35 down by at least half — provide better evidence that the problem extended beyond Strategy.
The pressure eventually reached the companies’ Bitcoin reserves. In July 2026, the group became a net seller for the first time, disposing of approximately 2,500 more BTC than it acquired, according to BitcoinTreasuries.net data cited by the FT. Strategy drove much of that reversal as it moved from one-way accumulation toward active capital management, a change Coindoo examined in its report on Strategy’s recent Bitcoin sales.
The gap between Bitcoin’s 30% decline and the group’s roughly 55% market-cap loss points beyond the underlying asset. Investors also withdrew the share-price premiums that had supported the companies’ financing strategies.
Why the Share-Price Premium Mattered
The treasury model worked most efficiently when investors valued a company above the net worth of its Bitcoin and other assets. That premium allowed management to raise more capital without giving away as much ownership per dollar received.
How the Premium Funded More Bitcoin
- The shares traded above the company’s net asset value.
- Management issued securities on favorable terms.
- The proceeds funded additional Bitcoin purchases.
- Bitcoin per diluted share could continue rising.
- Stronger per-share results supported further financing.
Once that premium contracts, selling common shares may fail to increase Bitcoin per diluted share enough to compensate existing investors. Debt and preferred stock can delay direct common-share dilution, but they add interest, dividends, senior claims and refinancing risk.
A higher Bitcoin price lifts the value of the reserve. It does not automatically restore the premium, lower financing costs or make another securities issuance attractive. Treasury-company shares can therefore remain depressed even after BTC itself establishes support.
Four Tests Matter More Than Another Bitcoin Purchase
Headline reserve growth no longer demonstrates that the corporate model is creating value. Investors now need evidence from the shares and the financing behind them:
- Bitcoin per diluted share: New purchases should increase per-share exposure after accounting for every security issued to finance them.
- Net-asset-value premium: A sustainable premium would reopen financing options without sharply diluting existing holders.
- Cash coverage: Companies need enough dollars to meet interest and dividend obligations without selling BTC at weak prices.
- Performance against spot ETFs: The shares must provide a clear benefit, such as stronger per-share accumulation or operating earnings, to justify their added corporate and governance risks. Since US spot Bitcoin ETFs launched in January 2024, investors have had a direct, lower-complexity route to Bitcoin exposure, sharpening the question of what treasury shares add on top of it.
Bitcoin no longer has to fall for treasury companies to struggle. From here, BTC determines the value of their reserves; financing discipline determines how much of that value reaches shareholders.
This article is for informational purposes only and does not constitute financial or investment advice. Bitcoin and Bitcoin-linked equities can experience substantial volatility. Corporate treasury companies also carry financing, dilution, liquidity, governance and operational risks that do not apply to holding Bitcoin directly.
