Bitcoin Nears Major Resistance as Traders Watch $80.8K to $84K
Key Takeaways
- •Bitcoin briefly rose above $81,000 after recovering its 50-, 100- and 200-day simple moving averages.
- •The main resistance cluster is near $80,800 to $84,000, combining the 50-week average, a historical $82,000 price shelf and a 0.382 Fibonacci retracement.
- •Daily RSI is near 84, indicating the rally is extended, while monthly RSI is around 52 and not overbought.
- •Nvidia is scheduled to report earnings on August 26, and the results could influence the AI-to-crypto rotation narrative.
- •Upcoming U.S. GDP, PCE inflation and jobless claims data may affect Treasury yields, the dollar and Bitcoin’s ability to break higher.
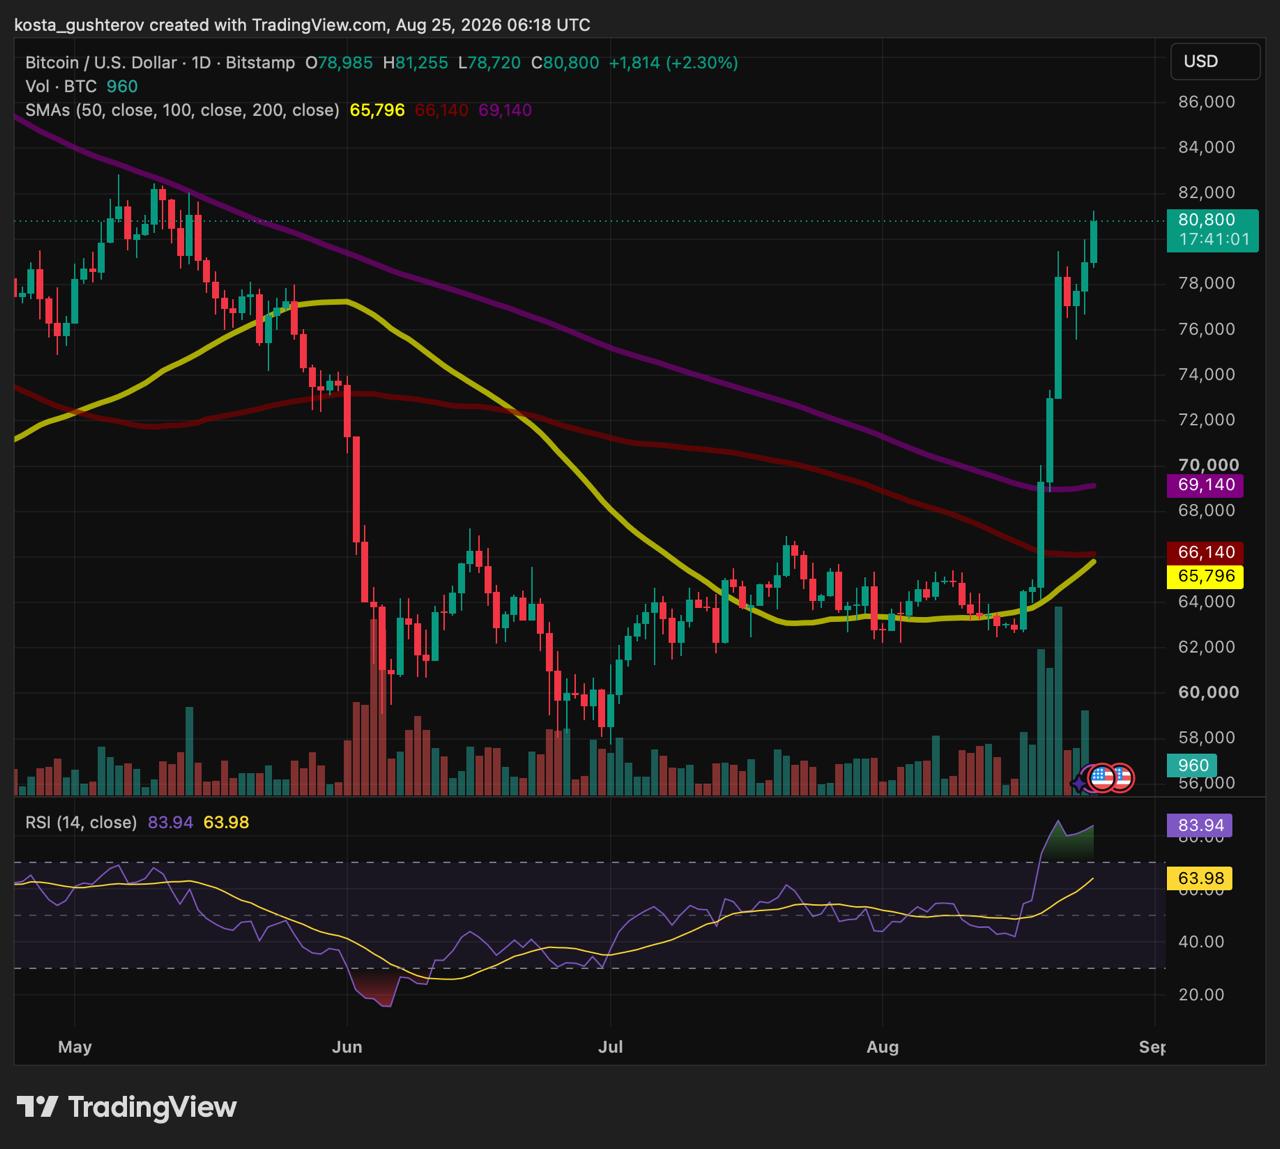
Bitcoin briefly moved above $81,000 as it tested a dense resistance band built around the 50-week moving average, a prior price shelf, and a longer-term Fibonacci retracement.
Key takeaways
- Bitcoin briefly traded above $81,000.
- The 50-week average sits near $80.8K.
- Historical resistance begins around $82K.
- The 0.382 Fib level sits near $84K.
- Nvidia and U.S. data may test momentum.
Bitcoin reaches its first major hurdle on the daily chart
Bitcoin’s push above $80,000 did not happen in isolation. The cryptocurrency has reclaimed its 50-, 100-, and 200-day simple moving averages after spending much of the summer below those levels. On the daily chart, the May high around $81,000 and the $82,000 area now stand out as the first clear obstacles, which helps explain why traders are focusing on whether the move can hold beyond a single intraday burst.
The rally has been sharp, with Bitcoin rising quickly from the low-$60,000 range while volume expanded during the initial breakout. That combination helped buyers push BTC above $81,000.
Daily RSI is near 84, which indicates that the move is stretched. However, RSI is a momentum gauge rather than a sell signal. Bitcoin can remain overbought during strong advances, and the reading mainly suggests that buyers are now confronting resistance after a rapid climb rather than after a prolonged consolidation.
The $80.8K to $84K zone stands out on higher time frames
A wider view shows why the current area matters. Bitcoin is trading close to the 50-week simple moving average near $80,800. Above that, a historical price shelf appears around $82,000, while the 0.382 Fibonacci retracement of the larger decline is near $84,000.
Together, those levels form one resistance zone rather than separate targets. The weekly average will continue to move over time, but the $82,000 region has previously attracted supply. The Fibonacci retracement adds a longer-term reference just above that shelf.
The monthly chart shows the same $82,000 shelf, and its Fibonacci level also lands near $84,000 because it measures the same major swing. Bitcoin therefore needs to build acceptance above a compact area where a moving average, prior price action, and a long-term retracement converge. That makes the area important not just as a chart feature, but as a test of whether the latest move has enough follow-through to shift the broader structure.
The close will matter more than the intraday move
Different time frames tell different stories. The daily chart captures the current pace of the rally, the weekly chart shows whether the move is changing the medium-term structure, and the monthly chart places it in the broader cycle.
Momentum looks different depending on the lens. Daily RSI is elevated near 84, while monthly RSI is close to 52 and remains far from overbought. In other words, the immediate move is hot, but the broader market does not show the same degree of exhaustion.
A brief wick above $81,000 would not settle that distinction. A weekly close above the resistance zone would carry more significance, while a monthly close above roughly $84,000 would show that buyers have moved beyond the long-term Fibonacci reference and held above the historical shelf.
Nvidia could test the AI-to-crypto rotation thesis
Bitcoin’s rebound has revived a familiar market argument: capital may be leaving an overcrowded AI trade and searching for opportunities in crypto. A recent report shared by Yahoo Finance also highlighted commentary from the crypto market making that case.
There is not yet enough evidence to call it a durable rotation. A few sessions of Bitcoin strength alongside weakness in AI-related stocks can reflect profit-taking, shifting interest-rate expectations, or broader repositioning across risk assets.
Coindoo explored in June why an unwind in the AI bubble could eventually support a crypto bull market. A contained pullback in AI shares could free up capital for other trades, while a broader selloff would likely pressure Bitcoin as well.
Nvidia’s results on August 26 could provide a test of that idea. The company is scheduled to report after the U.S. close, according to its investor-relations calendar.
A Yahoo Finance earnings preview says Nvidia has beaten consensus estimates in 13 consecutive quarters. Analysts expect about $92.1 billion in revenue and adjusted earnings of roughly $2.09 per share. Nvidia’s prior outlook, issued in its May earnings release, called for revenue of $91 billion, plus or minus 2%.
Another strong beat and upbeat guidance could help restore confidence in AI shares. By contrast, a disappointing report or cautious outlook would reinforce concerns that expectations have become too high. Bitcoin’s reaction would still depend on the broader market: a contained AI pullback may support the rotation narrative, while broad risk aversion could weigh on BTC alongside technology stocks.
Inflation, growth, and labor data could move the same trade
The macro calendar is also busy ahead of the weekly close. July durable-goods orders are due on August 26. That same morning will bring the second estimate of second-quarter GDP and July Personal Income and Outlays, including the PCE inflation gauge, according to the Bureau of Economic Analysis. Weekly jobless claims follow on August 27.
Markets will view those releases through the lens of interest rates. Softer inflation or data that pushes Treasury yields lower could improve demand for risk assets and give Bitcoin more support at resistance. Higher-than-expected inflation could lift yields and the dollar, making an upside break more difficult.
Growth and labor reports can be less straightforward. Signs of slowing activity may revive hopes for rate cuts, but they can also make investors more defensive. In that environment, the reaction in yields, equities, and the dollar may matter more than any single headline number.
What happens if Bitcoin fails to clear resistance
If the rally loses momentum, the first meaningful weekly support is near $73,900, which corresponds to the 0.236 Fibonacci retracement.
A return to that level would leave Bitcoin’s recovery from the June lows intact, but it would also mean that the $80,800 to $84,000 area is still acting as resistance. The market is testing that zone now, and lasting acceptance above it would give the advance a firmer base.
This article is provided for informational purposes only and does not constitute investment advice.

