Bitcoin Tests $80,000 Support as Spot ETF Outflows Resume Before Fed Decision
Key Takeaways
- •Bitcoin was trading near $80,500 on Oct. 24, defending support between $79,658 and $80,000 after failing to hold above $84,000 and remaining well below its October high near $87,400.
- •U.S. spot Bitcoin ETFs posted $137.9 million in net outflows on Friday, Oct. 23, after a withdrawal of roughly $635.5 million the previous day, the largest single-day outflow since June.
- •BlackRock's IBIT and Fidelity's FBTC led Friday's outflows at $110.3 million and $31.8 million respectively, although the funds still recorded about $224 million in net inflows over the seven-session week.
- •The $79,658 to $80,000 support zone aligns with Glassnode's estimated cost basis of roughly $80,000 to $,500 for U.S. spot ETF and corporate treasury buyers, making a sustained break below it a key risk for recent entrants.
- •The Federal Reserve's decision is scheduled for Oct. 28, with U.S. GDP and PCE inflation data due Oct. 29, while Brent crude above $110 per barrel and Middle East tensions keep inflation concerns in focus.
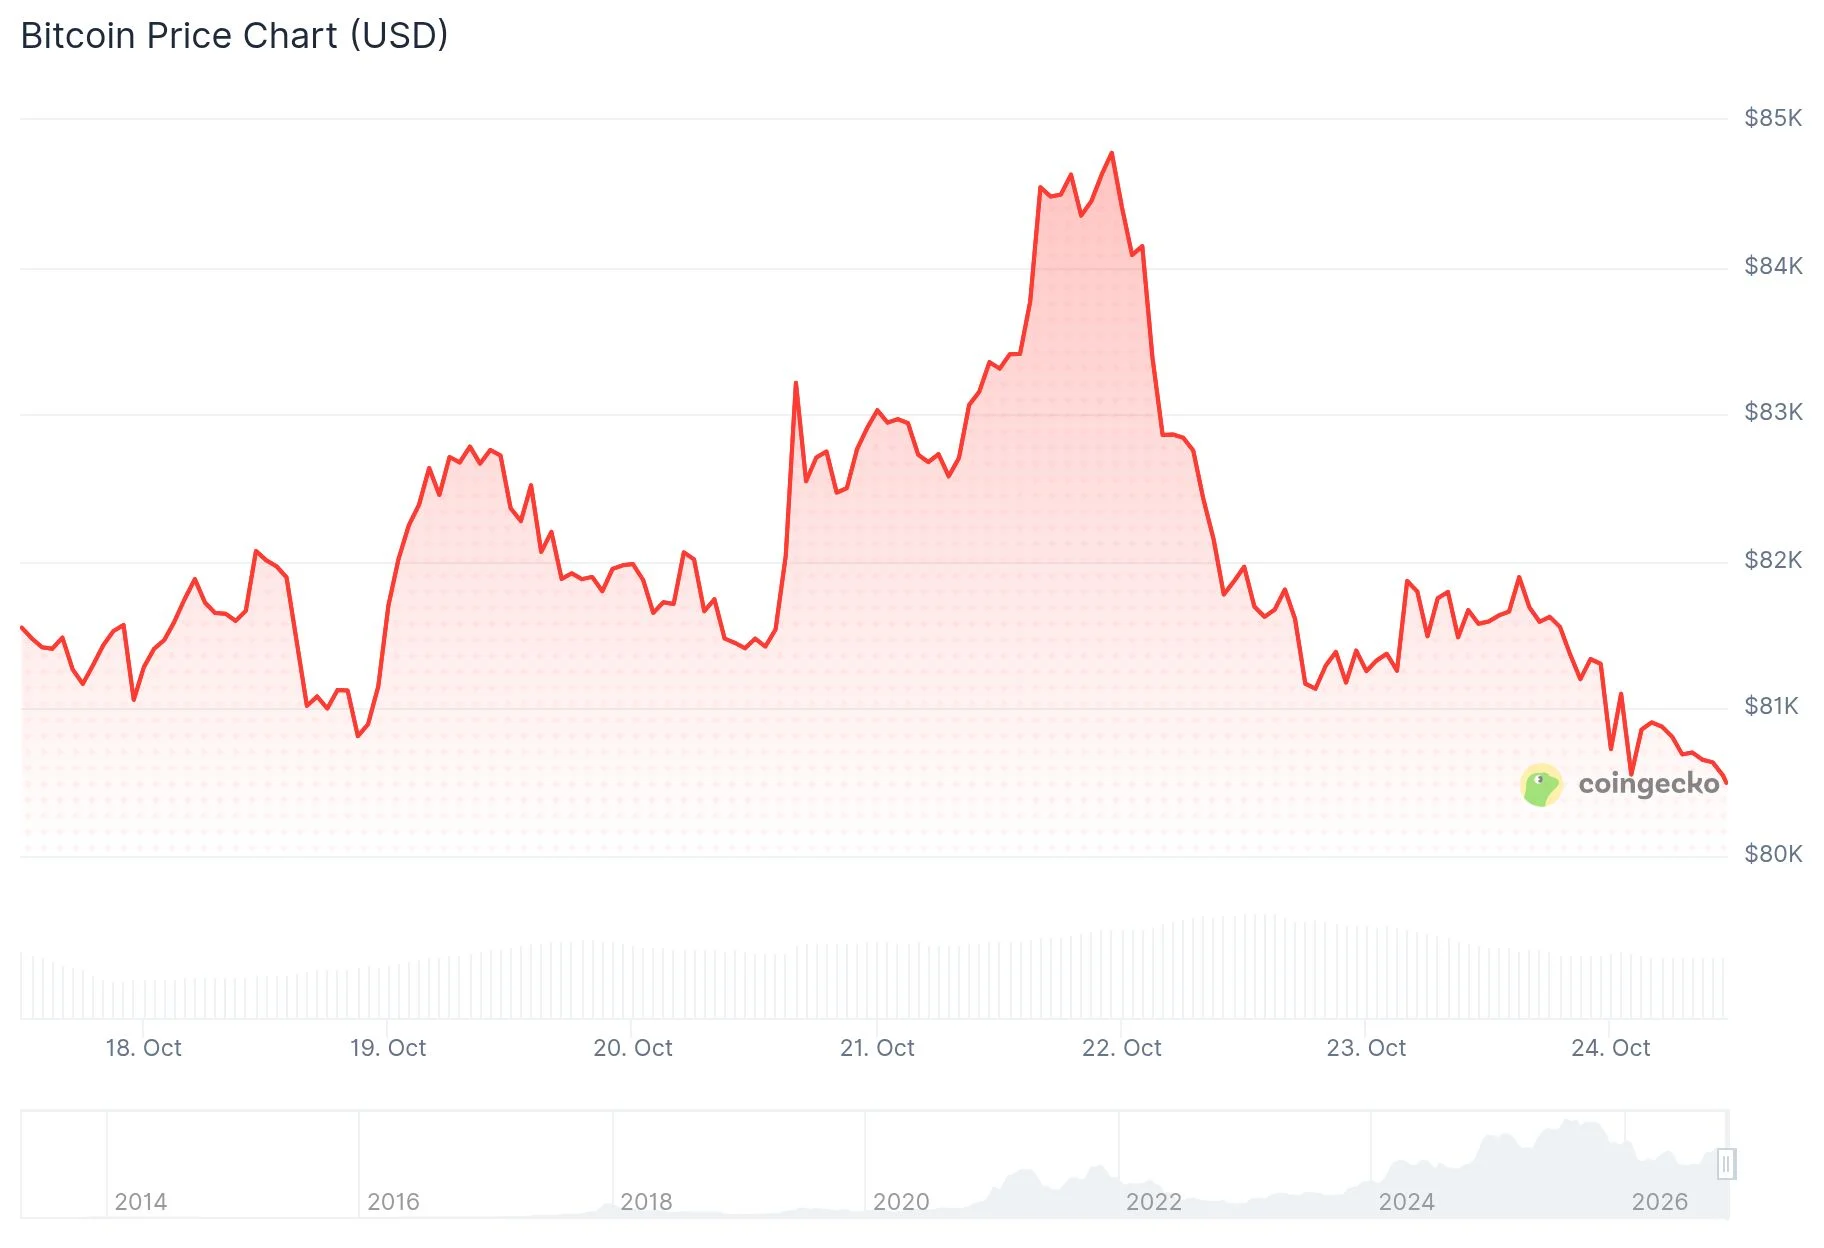
Bitcoin was trading near $80,500 on Oct. 24, testing support between $79,658 and $80,000 after falling as low as $80,315. The move came after another failed attempt to hold above $84,000, leaving Bitcoin well below its October high near $87,400.
On the Bybit daily chart, BTC opened near $81,048 and reached about $81,074 before retreating. Its market structure has weakened since the price broke below a steep rising trendline that began in August. Bitcoin is now moving between support near $80,000 and heavy supply in the mid-$80,000s.
Bitcoin ETF Outflows Resume
U.S. spot Bitcoin exchange-traded funds recorded $137.9 million in net outflows on Friday, Oct. 23, following a $635.6 million withdrawal on Thursday. Another account of the Thursday flow put the outflow at $635.5 million, describing it as the largest single-day withdrawal since June. BlackRock alone was reported to have recorded $254.1 million in outflows.
Spot Bitcoin ETFs, which the U.S. Securities and Exchange Commission approved in January 2024, hold Bitcoin directly and trade through standard brokerage accounts, so their daily creations and redemptions are among the most closely followed gauges of investor demand for the asset. Net outflows occur when redemptions outpace new creations, and issuers publish flow figures for every trading session, so the next daily prints will show whether the withdrawals extended into the following week.
Whale Meta wrote on X:
Bitcoin ETFs witnessed massive outflows of $635.5M on October 22, their largest single-day withdrawal since June. BlackRock alone recorded $254.1M in outflows. Despite the heavy selling pressure, $BTC continues to defend its crucial support levels. The question remains ; How… pic.twitter.com/JKM38kibvy — Whale Meta (@Whalemetaa) October 24, 2026
The post is available at https://x.com/Whalemetaa/status/2113897279971053871?ref_src=twsrc%5Etfw and
BlackRock’s IBIT accounted for $110.3 million of Friday’s outflows, while Fidelity’s FBTC lost $31.8 million. The week had started with inflows: Monday brought $526.7 million, Tuesday added $23.2 million and Wednesday added $524.8 million. Over the seven-session period, the funds still recorded approximately $224 million in net inflows.
Crypto Tony took a cautious view on X, identifying $79,800 as the next logical bounce zone and writing that the market’s weakness was disappointing but represented the current reality.
$BTC – Update $79,800 is the next logical bounce zone. Shame how weak we are, but that is the reality pic.twitter.com/xvlGoAvN8D — Crypto Tony (@CryptoTony__) October 24, 2026
The post is available at https://x.com/CryptoTony__/status/2113898718089077008?ref_src=twsrc%5Etfw and
Doctor Profit expressed a different view, writing that when BTC touches the box shown on his chart, he accumulates more on existing long positions. He described the zone as one for buying rather than panic.
$BTC : Whenever BTC touches this box, its time to accumulate more on existing longs. This is what I am doing, the box is for buying rather than to Panic pic.twitter.com/hJzemrpCE2 — Doctor Profit 🇨🇭 (@DrProfitCrypto) October 23, 2026
The post is available at https://x.com/DrProfitCrypto/status/2113772251749523537?ref_src=twsrc%5Etfw and
Chart and On-Chain Data
The immediate chart support is between $79,658 and $80,000, a level buyers have defended repeatedly this month. The range also aligns with on-chain analytics firm Glassnode’s estimated cost basis for U.S. spot ETF and corporate treasury buyers, which is approximately $80,000 to $81,500. A sustained trade below that range would leave those buyers’ aggregate position at an unrealized loss, which is one reason the zone is treated as a key reference level for recent entrants.
Bitcoin’s daily relative strength index was 43.32, below neutral but not in oversold territory. The relative strength index is a momentum gauge measured on a scale from 0 to 100, with readings under 30 generally classed as oversold and above 70 as overbought. The MACD remained bearish, with its histogram negative.
Glassnode said realized profit-taking had fallen to roughly half the pace recorded around September’s high. Selling by holders who bought Bitcoin one to two years ago was below one-third of its early-October peak.
Bitcoin’s MVRV ratio was around 1.50, well below the approximately 3.7 level associated with overheated markets. MVRV, or market value to realized value, compares Bitcoin’s market capitalization with the value of its supply measured at each coin’s last on-chain movement, and readings above 1 indicate holders in aggregate sit on unrealized gains. Overhead supply remained a hurdle, with Glassnode placing the cost basis of investors who bought six to 12 months ago at about $86,700.
Oil Prices the Federal Reserve
Brent crude had climbed above $110 per barrel, while higher oil prices and tensions in the Middle East kept inflation concerns in focus. Energy costs feed directly into consumer price readings, and the PCE inflation data scheduled for Oct. 29 is the Federal Reserve’s preferred gauge of price pressures.
The Federal Reserve’s decision was scheduled for Wednesday, Oct. 28. Markets considered a rate increase unlikely. U.S. GDP and PCE inflation data were due on Oct. 29. Federal Reserve meetings are followed across asset classes because the central bank’s policy rate influences borrowing costs and liquidity conditions throughout the financial system.
Bitcoin was trading at approximately $80,500 as the Federal Reserve meeting approached. The original report was published by CoinCentral: https://coincentral.com/bitcoin-btc-price-btc-tests-80k-support-as-etf-outflows-return-ahead-of-fed-decision/

