Bitcoin Tests $77K Support as $81.7K Supply Wall Limits Recovery
Key Takeaways
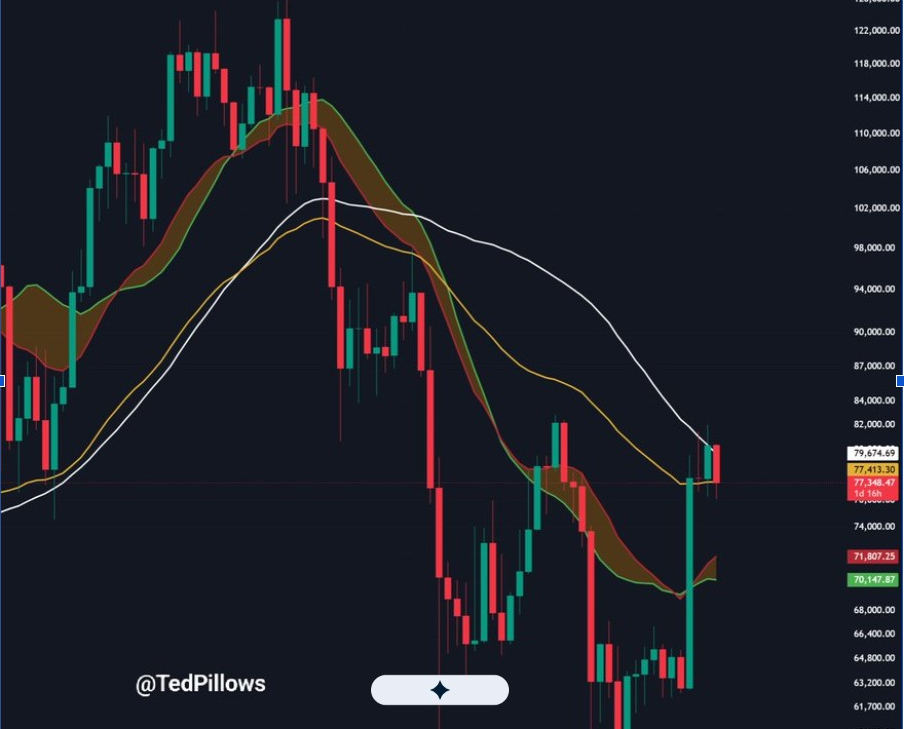
- •Bitcoin's recovery stalled below $80,000, leaving the price testing a weekly support zone near $77,000 that coincides with the 50-week exponential moving average at roughly $77,400.
- •A resistance cluster between $81,700 and $88,700 combines the 365-day moving average, the 3x Metcalfe valuation band, and about one million BTC concentrated among long-term holders between $84,000 and $87,000.
- •Analysts consider a daily close above $83,000 necessary to weaken the bearish daily structure, with continued rejection keeping $72,000-$73,000 and the $62,000-$65,000 demand zone in focus as downside levels.
- •BlockHorizon data shows roughly one million BTC held by short-term investors between $62,000 and $65,000, an area where CryptoQuant estimates about 476,000 BTC was accumulated during 2026.
- •One technical view suggests a Q4 dip toward $66,000-$68,000 could complete the right shoulder of an inverse head-and-shoulders pattern, while a separate long-term logarithmic channel model projects targets of $220,000, $320,000, and $420,000.
Bitcoin traded near $77,300 on Sept. 12 after its latest recovery stalled below $80,000. BTC briefly approached $79,700 on Sept. 11 before sellers pushed it back toward a major weekly support area.
The market now faces several resistance levels between $81,700 and $88,700. Technical and on-chain data identify major downside support between $62,000 and $70,000 if Bitcoin loses its current range. Analysts say a daily close above $83,000 would be needed to weaken the current bearish structure; otherwise, downside risk could extend toward $62,000.
Bitcoin Holds Near the 50-Week EMA
Bitcoin traded near $77,500 after failing to sustain its move toward $80,000. Analyst Ted noted that this area aligns with the 50-week exponential moving average (EMA). BTC crypto price prediction places the average near $77,413, while the 50-week simple moving average is near $79,675.
A break below $77,000 would weaken the current support test. Under that scenario, the same analysis identifies $72,000 to $73,000 as the next downside area. Bitcoin also remains above a broader weekly support band near $70,000 to $71,800, which includes the bull-market support band tracked in the analysis.
$81.7K to $87K Creates a Resistance Cluster
CryptoQuant data places Bitcoin’s 365-day moving average near $81,700, treating that level as the first major barrier above the spot price. A second valuation level sits near $83,600 on the 3x Metcalfe band. Bitcoin would need to clear both areas to extend its recovery.
On-chain supply presents another obstacle. BlockHorizon data shows about one million BTC concentrated between $84,000 and $87,000 among long-term holders. A separate CryptoQuant estimate identifies heavy supply between $77,100 and $80,200. Long-term holders sold up to 539,000 BTC over 30 days in 2026.
These concentrations place multiple resistance measures within a relatively narrow range. CryptoQuant also tracks the upper trader realized-price band near $88,700. According to the analysis, selling pressure has historically increased as Bitcoin approaches that upper cost-basis band.
Bitcoin Needs a Daily Close Above $83K
Crypto Patel described Bitcoin’s daily structure as bearish while the price remains below $83,000. His chart tracks an all-time high, lower highs, a break of structure, and lower lows. The latest rebound has brought Bitcoin back toward the $82,000 to $83,000 bearish order-block area.
A daily close above $83,000 would weaken that structure and open the possibility of a change of character. Continued rejection would keep lower support zones in focus. The same analysis marks a fair-value gap near $68,000 to $69,000 and a broader demand zone around $62,000 to $64,000.
BlockHorizon data supports the importance of the lower zone. Its chart shows about one million BTC held between $62,000 and $65,000 by short-term holders. CryptoQuant separately identifies roughly 476,000 BTC accumulated between $62,000 and $65,000 during 2026.
Analysts Monitor $66K Support and Longer-Term Projections
Another technical view points to a possible move toward $66,000 to $68,000 during the fourth quarter. Wealthmanager said such a decline could complete the right shoulder of an inverse head-and-shoulders pattern. The chart then projects a recovery toward the low-$80,000 area if the pattern develops.
EGRAG Crypto takes a considerably longer-term view. His logarithmic channel keeps Bitcoin within a rising macro structure that has held across several market cycles. He lists $220,000, $320,000, and $420,000 as long-term targets linked to channel structure, mean reversion, and time expansion.
Those projections use a different timeframe from the current support test. In the near term, Bitcoin price action remains focused on $77,000 support and the resistance cluster above $81,700.
The article is for informational purposes only and does not constitute financial or investment advice. Cryptocurrency investments involve risk, and readers should conduct their own research before making investment decisions.
Primary source: https://themarketperiodical.com/2026/09/13/bitcoin-price-tests-support-as-81-7k-supply-wall-caps-the-latest-rally
Crypto Patel: https://x.com/CryptoPatel/status/2098705678600716531?s=20
Wealthmanager: https://x.com/Wealthmanager/status/2098701249420116131?s=20
EGRAG Crypto: https://x.com/egragcrypto/status/2098697194190537050?s=20
