Bitcoin Can Keep Falling Without a Volatility Panic: Why the Latest Bottom Signals Fall Short
Key Takeaways
- •Binance's Bitcoin taker buy/sell ratio dropped to 0.85, its lowest level in over a year, showing sellers initiated roughly 54% of classified trades on the venue's perpetual swaps.
- •Friday's crypto liquidations reached $1.64 billion, with long positions accounting for nearly 89%, meaning mechanical margin closures contributed to the sell-heavy tape behind the contrarian signal.
- •Deribit's DVOL index at 40.77 reflects subdued expected volatility consistent with a controlled grind lower, because the index measures the width of anticipated price movement rather than its direction.
- •US spot Bitcoin ETFs posted $1.44 billion in outflows across five consecutive sessions from November 5 to November 11, indicating weakening demand despite roughly 1.3 million BTC in tracked fund holdings.
- •Bitcoin traded below $70,000 for the first time since August while the one-week 25-delta put skew climbed to around 14%, so the contrarian rebound case remains unconfirmed by the article's absorption standard.
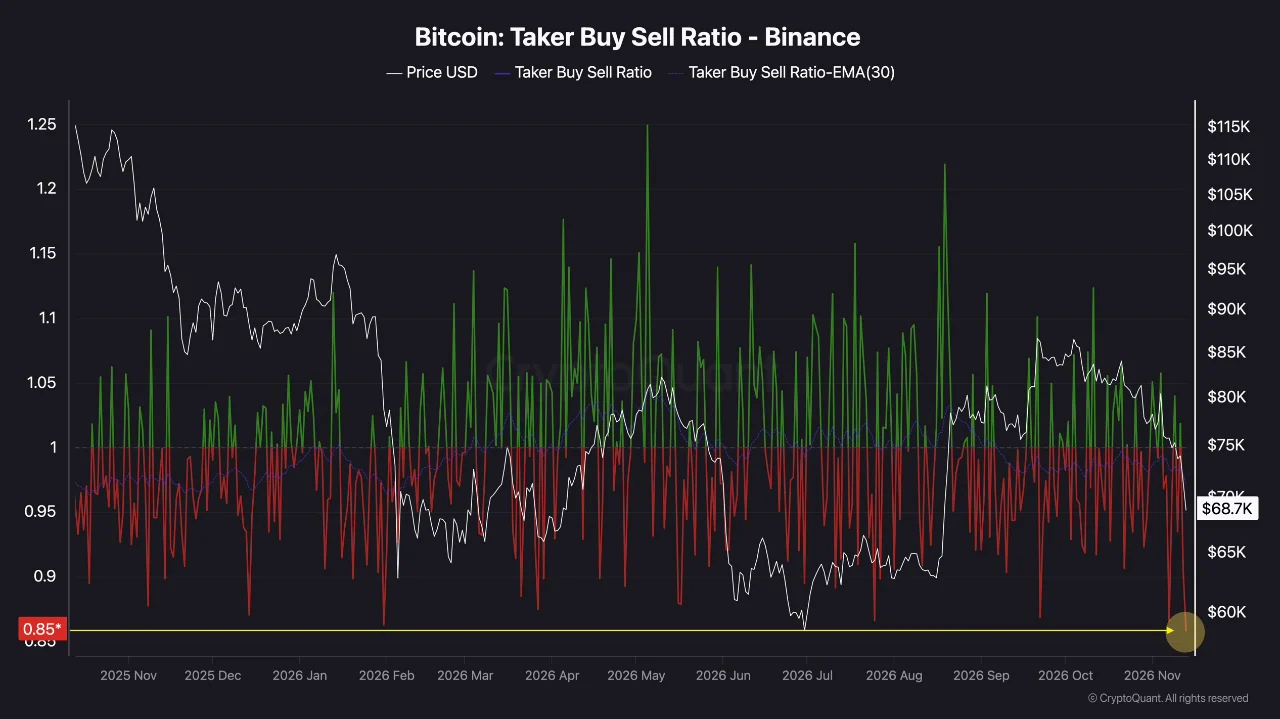
Two CryptoQuant posts published on November 13 — Darkfost on Binance futures execution and The Daily Digits on options pricing — are being read by parts of the market as bottoming signals. Both analyses are worth reading. Neither, however, measures the one thing a genuine bottom requires: buyers absorbing supply at a price that holds.
A 0.85 taker ratio measures urgency, not exhaustion
Darkfost reports that Binance's Bitcoin taker buy/sell ratio fell to 0.85, its lowest reading in more than a year, and suggests the extreme could precede a short-term rebound. The arithmetic behind the number is straightforward: for every 85 units of buy-initiated volume there were 100 units of sell-initiated volume, meaning sellers initiated roughly 54% of the classified trades.
What the ratio records is who crossed the spread. A seller hitting a resting bid is paying for immediacy; the buyer on the other side placed that bid in advance and chose the price. The reading shows that impatience currently sits on the sell side. It says nothing about how deep the queue of resting bids is, or how quickly it refills.
Scope narrows the interpretation further. CryptoQuant's metric documentation defines the series on perpetual-swap volume at a single venue. Binance ranks among the largest crypto derivatives venues, and readings from its book are quoted market-wide — the measurement itself, however, still covers only that one venue's tape. A sell-initiated trade that opens a fresh short, one that closes a long, and one fired by a liquidation engine are all counted the same way. That distinction matters this week: CoinDesk's Friday report puts crypto liquidations at $1.64 billion, with longs making up almost 89% of them, and Bitcoin futures liquidations alone at $916 million, 95% of which were longs. Forced long closures are recorded as taker sells. A liquidation is mechanical rather than discretionary: when a leveraged long can no longer meet its margin requirement, the venue closes the position automatically by selling into the order book. A portion of the ratio's “urgency,” then, came from margin engines rather than conviction.
The taker ratio identifies who is impatient. Whether the other side keeps absorbing that impatience is a separate measurement — and the same gap runs through the way the options reading has been used.
Low DVOL fits a grind lower, not a floor
The Daily Digits reports Deribit's DVOL index at 40.77, with Bitcoin 17.4% below its rolling 30-day closing high, using a reference price near $68,667 at the time of its snapshot. The study compares that reading with 290 similar drawdown days since March 2021, and separately with the drawdown days of 2026 alone. The medians are as reported by The Daily Digits on CryptoQuant; the percentage gaps were calculated by the Coindoo.com team, and the historical sample has not been independently reconstructed.
The two samples tell different stories, and the second is the more honest one. The long sample is dominated by the 2021 and 2022 regimes, when drawdowns routinely arrived with much wider expected swings. The study's own 2026 median shows this year's declines have been priced far more calmly, which shrinks the “half the usual fear” gap to under a fifth. Measured against 2026 standards, today's reading is mildly subdued, not an anomaly.
Sample size deserves the same scrutiny. Those 290 qualifying days are calendar days, and a single multi-week decline can contribute dozens of them. They represent a handful of selloffs observed many times over, not 290 independent episodes from which a rebound rate can be read.
There is also the question of what DVOL actually prices. Deribit's methodology describes an annualized measure of expected variability over the next 30 days — the width of the range the options market is paying for, with no view on direction. Width and direction come apart easily. An asset that loses 1% on each of ten consecutive sessions ends down about 9.6%, having never printed a single day larger than 1%. That is a stylized path rather than Bitcoin's actual one, but it illustrates why a sell-heavy tape and a calm volatility index can sit comfortably together inside a controlled decline. Low DVOL during a 17% drawdown is what a grind looks like.
The test is whether price stops falling under the same selling
If sellers keep hitting bids and price stops making new lows, resting buyers are absorbing the supply. If selling of similar size keeps reaching lower prices, the bids are being pulled back or are demanding a bigger discount. Only that comparison distinguishes a bottom from a pause.
Reading it takes patience. A large displayed bid can vanish before anyone trades against it, and a brief stabilization can be nothing more than positions being squared ahead of an expiry. Executed trades across several liquid venues, measured over days rather than hours, are the proper standard, because they record prices buyers actually accepted.
On that standard, Friday did not help the rebound case. Bitcoin traded below $70,000 for the first time since August, with 51.9% of taker volume still on the sell side, according to CoinDesk. Selling of a familiar size reached a lower price.
1.3 million BTC in funds is a stock, not a flow
The options study also cites tracked fund holdings near 1.3 million BTC as a sign of institutional resilience. CryptoQuant's Fund Holdings series counts trusts, ETFs and closed-end funds together, and what it reports is a level. Demand is a change in that level — and the change this month has been negative.
Farside Investors' flow table shows US spot Bitcoin ETFs posting outflows on five consecutive sessions from November 5 to November 11, totaling $1.44 billion, with $299.8 million leaving on November 11 alone. The November 12 figure stood at a preliminary $47.7 million outflow at the time of writing, with BlackRock's IBIT and Fidelity's FBTC still to report. The daily cadence is what makes the table usable as a near-real-time demand check — a role the slow-moving holdings level cannot play.
At prices around $70,000, $1.44 billion is roughly 20,000 BTC, or about 1.5% of a 1.3 million BTC balance. A rounded holdings figure swallows an outflow of that size without visibly moving, which is why the balance cannot stand as evidence that demand is intact. The flow series is narrower than the holdings chart, and a fund redemption is not an instant exchange sale, so the two numbers are not in contradiction. They answer different questions, and only one of them is about demand.
Coindoo's earlier piece on crypto's cash supply shrinking at its fastest pace since 2022 covers the other side of the ledger: the pool of liquidity available to meet this selling has been contracting at the same time.
What a real recovery case would need
Start with the futures book, because a bounce from here would begin there. CoinDesk's Friday data has funding moderately negative — meaning shorts are paying longs — after it was moderately positive on Thursday. Negative funding combined with heavy long liquidations is the setup for a short-covering bounce. That kind of move lifts price without proving spot demand, and the way to tell the two apart is open interest. Bitcoin futures open interest fell 5.4% on Friday against a 5.9% drop in price, meaning the number of contracts barely changed and the dollar decline was mostly the lower price. A rebound that adds contracts while funding turns only modestly positive and price holds would signal fresh risk-taking. A rebound that burns off contracts is shorts leaving.
Then check the part of the options market DVOL does not show. The one-week 25-delta skew — the premium traders pay for puts over equivalent calls — was about 10% on November 10, about 11% on November 12 and around 14% on Friday, per CoinDesk. The expected size of the move is subdued; the price of protection against its direction has been rising all week. A genuine recovery case would want that premium shrinking on days when price holds, not only on days when it bounces.
Finally, set implied volatility against realized. One-week at-the-money implied volatility eased to about 35% on Thursday, which prices a typical daily move of roughly 1.8% once the annualized figure is scaled to a single day. Friday's drop of more than 3% before midday UTC was about double that. When realized moves run ahead of what options priced, the market is behind the move rather than relaxed about it — and “cheap” options can simply be options that had not yet caught up.
If spot keeps printing lower lows while sell-initiated volume dominates, the contrarian rebound case stays unconfirmed, whatever DVOL does.
Data context: both CryptoQuant posts were published on November 13, 2026 and use different snapshots. Derivatives readings are from CoinDesk's daily market reports of November 10–13 and are stated as of their publication. The daily-move figure of roughly 1.8% is Coindoo's calculation from the reported 35% implied volatility. The Farside figure for November 12 was preliminary at the time of writing.
Source: Coindoo
Disclaimer: This article is market analysis, not investment advice. It does not estimate the probability of a Bitcoin rebound or predict any price move. Every indicator discussed is attributed to its publisher, and the scenarios described are ways of reading current data rather than forecasts. Cryptocurrency markets are volatile and leveraged positions can be liquidated quickly. Conduct your own research and consult a licensed financial adviser before making any investment decision. Coindoo and the author hold no responsibility for losses arising from decisions based on this content.

