Why Bitcoin and Ether Are Rising: Trump’s Crypto Push and a $3.1 Billion Short Squeeze
Key Takeaways
- •Bitcoin climbed 12.91% to $73,032.76 between the August 18 and August 20 snapshots, breaking out of a six-week range, while Ether gained 21.39% to $2,326.38 and led major assets.
- •The U.S. Treasury announced on August 19 that buybacks of 10- to 30-year securities would rise from $2 billion to at least $4 billion per operation between September 9 and November 4 to support liquidity in longer-duration debt.
- •Trump said a large U.S. government Bitcoin position had been discussed but disclosed no purchase amount, timeline, or funding mechanism, and separately urged Congress to pass a fair version of the CLARITY Act.
- •Crypto short liquidations totaled about $3.1 billion over the two days, the second-largest such event on record, coinciding with BTC exchange net outflows of 12,058.94 BTC and stablecoin exchange inflows of $397.73 million.
- •Sustaining the rally requires Bitcoin holding above the prior $66,000 range top, continued positive Bitcoin and Ether ETF flows, and ongoing BTC exchange outflows, as no actual government Bitcoin purchase has been executed.
Quick answer
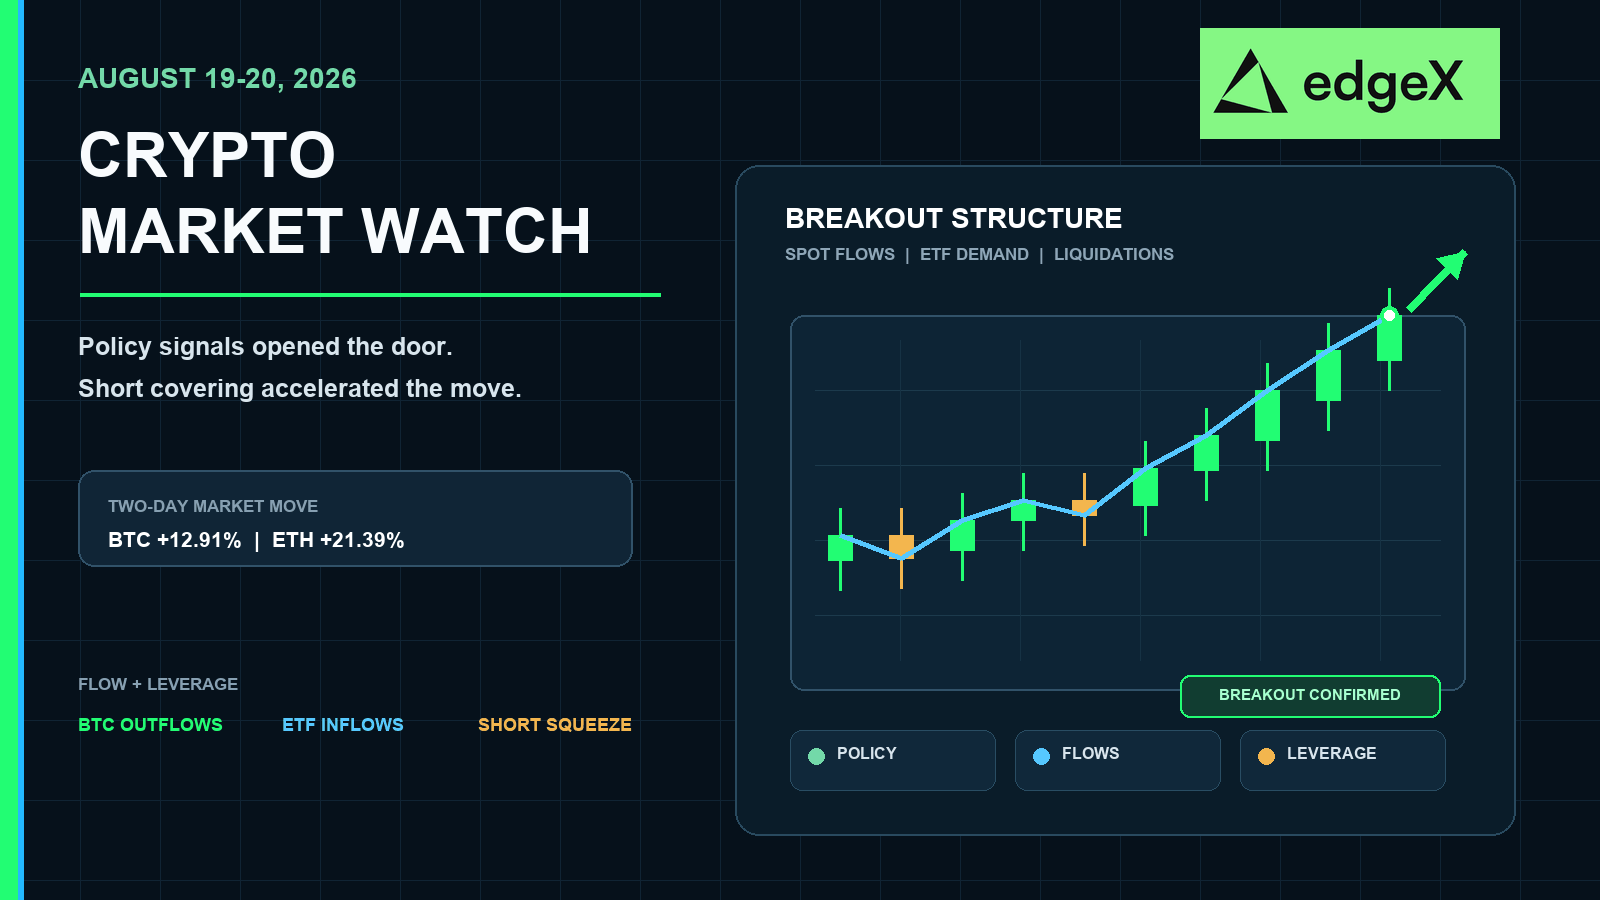
Cryptocurrencies rose because multiple catalysts piled onto a crowded short market. On August 19, the U.S. Treasury said it would double buybacks of some 10- to 30-year Treasuries to at least $4 billion per operation to ease pressure on the long end of the U.S. yield curve. That same day, Trump urged Congress to pass a “fair version” of the CLARITY Act and said he had discussed a large government increase in Bitcoin holdings, although no purchase amount, timeline, or funding mechanism was disclosed. Those policy headlines pushed BTC out of its six-week range, and that breakout then forced leveraged shorts to cover. On August 20, the rally extended into Ether and large-cap altcoins as ETF inflows, BTC exchange outflows, and stablecoin deposits confirmed a clear spot-liquidity component. Importantly, policy signals do not mean the government has already bought: this was a market repricing of expectations, moving faster than the policy can become executable.
Two catalysts lit the move
The first stage of the rally came from two separate parts of the policy mix: a Treasury liquidity measure that eased a macro headwind, and a set of crypto policy signals that increased the perceived value of future regulation and sovereign demand.
Treasury buybacks reduced the macro drag
The first catalyst came from the bond market. Reuters reported on August 19 that the Treasury would double buybacks of 10- to 30-year securities from $2 billion to at least $4 billion per operation between September 9 and November 4. The Treasury said the move was intended to support liquidity in longer-duration debt that the market can absorb more easily. Reuters also reported that 30-year yields had risen to 5.34% before the announcement, the highest since 2007, and then eased after the headline. This is not a solution to the U.S. fiscal deficit or Treasury supply problem, but it did send a credible signal that officials are willing to intervene when the long end becomes disorderly.
That matters for crypto because higher long-term yields raise the opportunity cost of holding volatile assets. When yields ease, the immediate macro discount rate becomes less unfavorable for Bitcoin and other high-beta assets. CNBC described the Treasury move as part of a broader alignment of macro and policy catalysts, while Reuters cited analysts who said the announcement offered only temporary relief to bonds. The right interpretation, then, is a liquidity pulse rather than a permanent shift in the fiscal picture.
Policy optionality repriced crypto
The second catalyst came from politics. Reuters reported on August 19 that Trump told a White House event with crypto industry executives that Congress should pass a “fair version of the CLARITY Act.” The bill would define when digital assets are treated as securities or commodities and divide regulatory responsibilities between the SEC and CFTC. Separately, the SEC on August 18 proposed a crypto exemption and conditional safe harbor framework, adding another near-term regulatory signal for the industry.
The headline that most moved markets was Trump’s answer when asked whether the U.S. might significantly increase Bitcoin holdings. The report said he replied that it had “certainly” been discussed. That is materially different from an appropriation, an executive-order purchase, or disclosed buying. The missing details — amount, timing, funding source, custody arrangements, and congressional authorization — are exactly what traders would need before treating the idea as a durable source of demand. Even so, for the two-day move, the option value was enough to change positioning.
The breakout met supply and liquidity bids
Flow data show why the policy headlines became a tradable move rather than just a one-session news impulse: available BTC inventory tightened while dollar-linked liquidity moved into venues where it could be deployed.
BTC exchange outflows tightened available supply
Market data explain why the move was bigger than any single headline. CryptoQuant recorded BTC exchange net flows of -2,012.840602 BTC on August 19 and -10,046.100648 BTC on August 20, for a two-day total of -12,058.941250 BTC. A net outflow means more BTC left the monitored exchanges than entered them. That does not prove every coin moved into long-term cold storage, but it does reduce the visible amount of BTC immediately available for sale on exchanges.
Stablecoins added deployable liquidity
At the same time, total stablecoin exchange net flows were +$365.932 million on August 19 and +$31.801 million on August 20, for a two-day total of +$397.733 million. Stablecoin inflows can be used for spot purchases, derivatives margin, or simply sit idle, so they do not directly measure executed buys. But in this context, stablecoin deposits plus BTC withdrawals formed a favorable liquidity mix: buying power was moving onto exchanges while BTC inventory was moving off them.
The exchange whale ratio rose from 0.22263892 to 0.24223488. That means the share of the top 10 BTC inflows in total exchange inflows was higher on August 20 than on August 19. It should not be read as “whales sold” or “whales bought.” The ratio measures concentration, while total BTC exchange flow measures net direction. The broader outflow signal still dominated.
Two-day crypto dashboard
| Signal | August 19-20 reading | Meaning |
| BTC price | $64,680.71 to $73,032.76 (+12.91%) | Range breakout and momentum expansion |
| ETH price | $1,916.46 to $2,326.38 (+21.39%) | ETH led the broader market |
| BTC exchange net flow | -12,058.94 BTC | BTC supply on exchanges contracted |
| Stablecoin exchange net flow | +$397.73 million | More stablecoin liquidity entered exchanges |
| BTC ETF flow | About +9.48K BTC | Strong inflows over the two days |
| ETH ETF flow | About +102.01K ETH | Inflow concentrated on August 19 |
| Exchange whale ratio | 0.2226 to 0.2422 | Slightly higher concentration in large inflows |
| Crypto short liquidations | About $3.1 billion over two days | Leverage amplified the initial move |
This dashboard describes a rally with both spot and derivatives components. Supply data helped the breakout extend; leverage data explain the speed.
Bitcoin broke the range, then shorts became fuel
A CoinMarketCap snapshot on August 18 showed BTC at $64,680.71 with a market cap of about $1.298 trillion. A snapshot on August 20 showed $73,032.76 with a market cap of about $1.466 trillion. Between those two moments, BTC market value increased by about $167.64 billion, before accounting for intraday movement between the snapshots.
CNBC reported that Bitcoin had been trapped for about six weeks between roughly $62,000 support and $66,000 resistance. Breaking above $66,000 changed the market’s reference point. Traders who had been selling near the top of the range were forced to buy futures back as spot prices rose, while momentum traders joined once the old resistance failed.
The two-day ETF flows reinforced the breakout. The provided CoinGlass snapshots in native units showed about +7.99K BTC on August 19 and about +1.49K BTC on August 20, for a combined two-day figure close to +9.48K BTC. Some individual funds in the August 20 table were marked with “-” rather than zero, so these figures should be treated as CoinGlass-reported totals for the funds shown, not as final audited numbers for each product.
The price signal and the flow signal therefore pointed the same way. ETF demand was positive, BTC exchange net flow was negative, and stablecoin exchange net flow was positive. That is a stronger breakout structure than a move driven by liquidations alone.
Ether led on relative performance
Ether rose from $1,916.46 on August 18 to $2,326.38 on August 20, a gain of about 21.39%, outperforming Bitcoin by about 8.5 percentage points. CNBC reported that Ether traded above $2,288 during the August 20 session and later described it near $2,251; Reuters reported Ether at $2,272 and said it hit a three-month high. Those are intraday and publication-time readings; the comparable historical snapshot used here is the $2,326.38 close.
ETF inflows were exceptionally strong. The provided CoinGlass table shows about +97.44K ETH on August 19 and about +4.57K ETH on August 20, for a combined two-day total of about +102.01K ETH. Nearly all of the two-day flow came on August 19. ETH therefore had both a relative-performance story and a regulated-products flow story.
Ether’s leadership does not automatically mean a durable alt season has begun. It does show that the rally broadened beyond the initial Bitcoin policy headlines. Confirmation would require ETH to hold the breakout while ETF flows stay positive and ETH/BTC continues rising, rather than giving back gains once the short squeeze fades.
Altcoins confirmed a broad high-beta re-rating
The August 18 to August 20 snapshots show a market-wide repricing, not just a Bitcoin jump. XRP rose from $1.0014 to $1.2684, up 26.66%. HYPE gained 25.76%, XLM gained 17.32%, DOGE gained 14.54%, ADA gained 14.17%, SOL gained 13.77%, and LINK gained 12.10%. BNB gained 8.51%, the smallest increase among the major non-stablecoins listed here.
| Asset | August 18 price | August 20 price | Two-day change |
| BTC | $64,680.71 | $73,032.76 | +12.91% |
| ETH | $1,916.46 | $2,326.38 | +21.39% |
| XRP | $1.0014 | $1.2684 | +26.66% |
| HYPE | $58.57 | $73.66 | +25.76% |
| XLM | $0.1547 | $0.1815 | +17.32% |
| DOGE | $0.07021 | $0.08042 | +14.54% |
| ADA | $0.1743 | $0.1990 | +14.17% |
| SOL | $77.03 | $87.64 | +13.77% |
| LINK | $9.5360 | $10.69 | +12.10% |
HYPE’s move is especially relevant because CNBC reported that Trump also hinted at possible regulation of Hyperliquid, a decentralized exchange linked to perpetuals trading. The token therefore had exposure both to the broad squeeze and to a project-specific policy narrative. XRP and XLM show that payments and settlement narratives also participated, while SOL and DOGE show that the bid was not confined to one sector.
The short squeeze was the accelerator, not the whole thesis
CoinGlass-based reporting showed about $3.1 billion in crypto short liquidations from August 19 to 20, with about $1.74 billion on August 20 alone. CNBC described it as the second-largest short liquidation event on record. The seven-day liquidation-history screenshot provided here showed a major peak near $1.63 billion in the red short-liquidation zone. Because that screenshot is a range chart rather than a daily table, the bar cannot be substituted for the full-day total.
Leverage explains speed; spot liquidity tests durability
Liquidations explain the vertical part of the move. A forced cover becomes a market buy order, which pushes price into the next liquidation pocket and forces more shorts to close. That feedback loop can move BTC from $66,000 to above $70,000 much faster than a traditional spot-demand model would imply. Once the forced buying runs out, it can also reverse quickly.
That distinction matters for the next session. A move supported only by liquidations often loses momentum once open interest rebuilds at higher levels. A move supported by ETF inflows, BTC exchange outflows, and stablecoin deposits is more likely to consolidate. The current data show both forces at work, so the correct conclusion is neither “pure short squeeze” nor “fully organic bull market.” It is a policy-driven repricing amplified by leverage and confirmed by favorable flow data.
What the 30-day liquidation maps say now
The provided CoinGlass 30-day exchange liquidation maps were viewed with visible Binance, OKX, and Bybit bars. They are estimates of where leveraged positions may be forced to close, not guaranteed support or resistance levels.
| Market | Current snapshot price | Heavier downside clusters | Nearby upside clusters |
| BTC | $74,512 | $61,600-$62,500, then $63,300-$64,200 and $65,500-$66,700 | Smaller clusters near $75,500-$77,300 and $78,900-$82,000 |
| ETH | $2,348 | $1,840-$1,870, then $1,945-$1,970 and $2,050-$2,100 | Smaller clusters near $2,400-$2,460 |
The asymmetry is worth noting: the largest estimated leverage pools still sit below the two snapshot prices. That does not mean an immediate drop. It means that if the rally fails and BTC or ETH roll over, forced long liquidation could accelerate downside through multiple zones. Conversely, the relatively lighter overhead clusters suggest that continued upside may require fresh spot demand rather than simply more remaining shorts.
What must happen next
The bullish continuation case has three tests. First, BTC must hold the old $66,000 range top instead of immediately slipping back into the prior six-week box. Second, Bitcoin and Ether ETF flows need to stay positive after the first two explosive days. Third, exchange flows should continue to show BTC leaving exchanges while stablecoins remain parked where they can be traded. If those conditions hold, then the policy headlines have become a durable position, not just a news trade.
The risk case is equally clear. If ETF inflows reverse, stablecoin deposits disappear, and BTC starts flowing back onto exchanges, then the large downside clusters on the liquidation maps become more relevant. ETH’s $1,840-$1,870 zone is the key visible relative-performance test on the map provided. The CLARITY Act remains stalled until Congress acts, and the discussion of large government purchases is still just that: discussion. A rally priced for policy that does not yet exist can give back part of that premium.
So the August 19-20 surge matters, but its message is specific: policy optionality opened the door, Treasury liquidity eased the macro headwind, spot flows supported the breakout, and short covering kicked the door in. The next phase depends on whether real demand can keep the door open after forced buying ends.
How to trade crypto with leverage without giving up custody
Decentralized perpetuals trading venues are no longer niche. According to CoinGecko’s 2025 Crypto Industry Report, DEX perpetuals volume jumped 346% last year to $6.7 trillion, while centralized exchange open interest fell 20.8% over the same period. Traders are putting a lot of capital into on-chain derivatives for a straightforward reason: counterparty risk is real, custody failures happen, and censorship resistance matters.
edgeX is a decentralized perpetual futures exchange built for traders who want market access without giving up control. Here is what it offers:
- No KYC, no barriers. Connect your wallet and start trading. No identity verification or account approval required.
- True self-custody. edgeX combines off-chain order matching with verifiable on-chain settlement secured by Ethereum. Even if the operator goes offline, the forced-withdrawal mechanism lets funds be recovered directly from the blockchain.
- Deep liquidity with tight spreads. edgeX maintains $10 million in market depth within one basis point of spread and keeps slippage below 0.1 basis points for trades above $100,000.
- Up to 100x leverage. Traders can scale positions to fit their risk framework, whether hedging exposure or trading momentum.
- 140% trading-fee rewards. Active traders can earn rewards from trading activity, lowering the net cost of high-frequency strategies.
- Institutional-grade infrastructure. edgeX can process up to 200,000 orders per second with matching latency below 10 milliseconds.
Start trading crypto perpetuals on edgeX now and put your market view to work.
Frequently asked questions
What dates does this crypto market watch cover?
It covers the August 19-20, 2026 crypto surge, using CoinMarketCap snapshots from August 18 and August 20 for comparable two-day price and market-cap readings. ETF and on-chain data use the UTC dates and CryptoQuant figures shown in the provided screenshots.
Was this rally caused by Trump’s comments about buying Bitcoin?
Those comments were an important catalyst, but not a completed buying plan. Trump said a large government increase had been discussed, but no amount, timeline, funding source, or purchase order was announced. The Treasury buyback announcement, CLARITY Act support, ETF inflows, and short covering all had to come together for the move to reach this size.
What does BTC exchange net flow show?
CryptoQuant recorded a combined -12,058.94 BTC from August 19 to 20. More BTC left the monitored exchanges than entered them. That is a favorable supply signal, but it does not prove all the outflow became long-term holdings or that it was not sold elsewhere.
Why did Ether outperform Bitcoin?
ETH gained about 21.39% from the August 18 to August 20 snapshots, compared with Bitcoin’s 12.91%. Ether also received about 102.01K ETH of displayed ETF inflows over the two days, with most of that on August 19. The combination of relative ETF demand and short covering helped ETH lead.
Is this a normal altcoin season?
Not yet. The move was broad, but it was only a two-day repricing. XRP, HYPE, XLM, DOGE, ADA, SOL, and LINK all outperformed or matched BTC, but the durability test is whether that breadth can persist after liquidations fade and ETF flows normalize.
What do the liquidation maps mean?
The 30-day BTC and ETH maps estimate price zones where leveraged positions may be forced to close. The BTC map shows the heaviest downside cluster near $61,600-$62,500, while the ETH map shows a heavier downside cluster near $1,840-$1,870. These are risk zones, not guaranteed targets or support levels.

