Bitcoin Tests Key Support as PPI Data Could Determine Next Price Move
Key Takeaways
- •July consumer inflation cooled, with headline CPI declining to 3.4% from 3.5% in June and core inflation falling to 2.5%.
- •The Bureau of Labor Statistics is scheduled to release July PPI data at 8:30 a.m. ET, with consensus expecting a 0.2% monthly increase in headline producer prices and a 0.3% rise in core PPI.
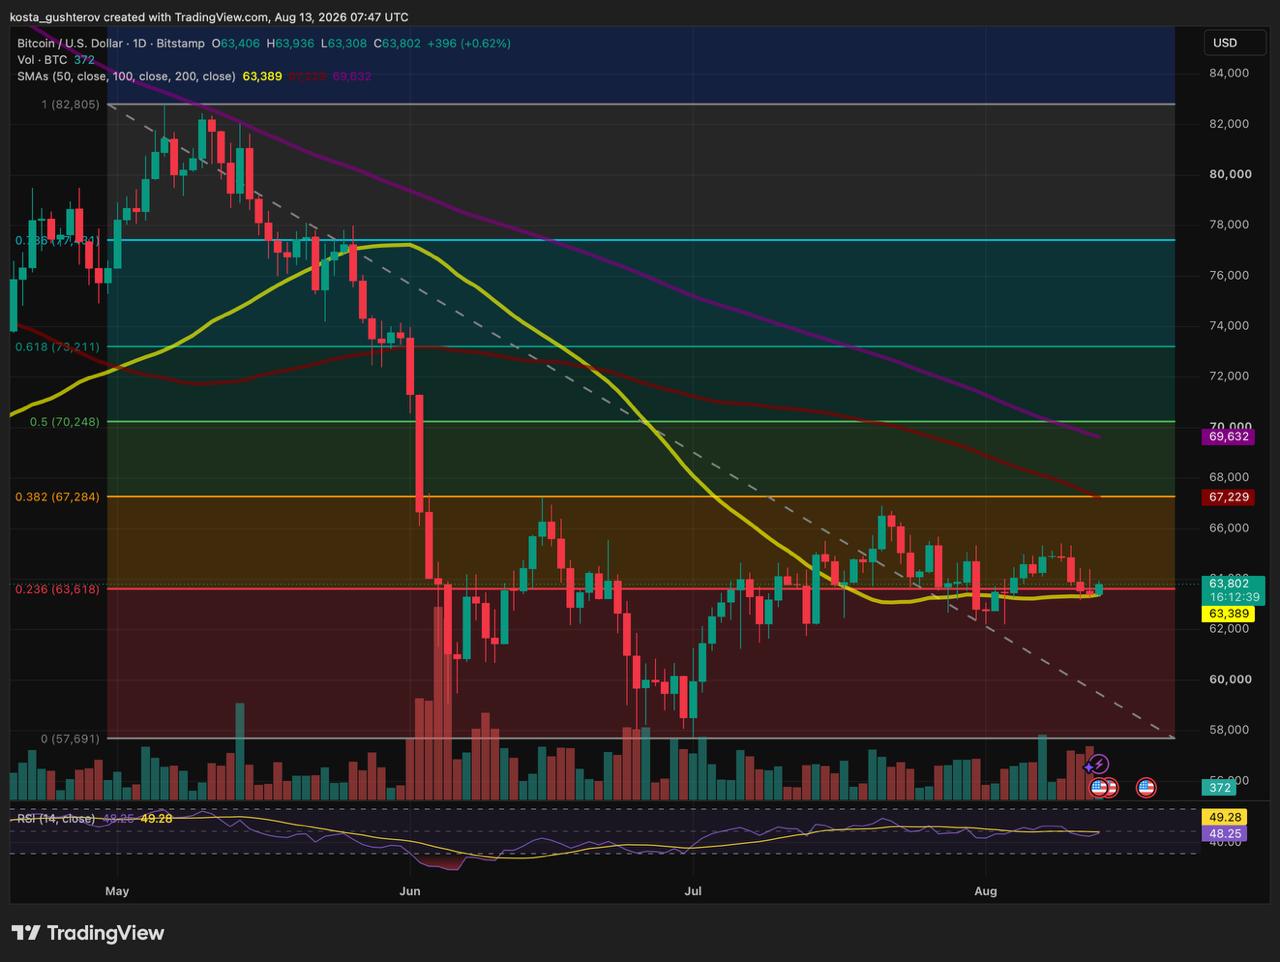
- •Bitcoin was trading near $63,800, sitting on its last major daily support cluster where the 50-day SMA at approximately $63,400 overlaps with the 0.236 Fibonacci retracement near $63,600.
- •Resistance is concentrated around $67,200-$67,300, where the 100-day SMA aligns closely with the 0.382 Fibonacci retracement level.
- •PPI components feed into the PCE price index that the Federal Reserve monitors most closely, meaning an upside surprise could shift expectations around the Fed's preferred inflation gauge.
The macroeconomic backdrop for Bitcoin began crystallizing this week following the release of US inflation data. Consumer prices eased in July, with headline CPI falling to 3.4% from 3.5% in June, while core inflation slipped to 2.5%. On a monthly basis, headline CPI rose 0.1% and core prices increased 0.2%. While the softer consumer-inflation reading provided some relief to markets, the upcoming producer-price report could either reinforce or complicate the emerging picture.
PPI Release Set for 8:30 a.m. ET
The Bureau of Labor Statistics is scheduled to release July Producer Price Index (PPI) data at 8:30 a.m. ET. Consensus expectations point to a 0.2% monthly increase in headline producer prices, following a 0.3% decline in June. Core PPI is projected to rise 0.3%.
A reading below those estimates would lend further support to the narrative established by Wednesday's CPI data. With consumer inflation already trending lower, weaker producer-price pressure would make it more difficult to argue that another inflation wave is building upstream in the supply chain.
Conversely, a stronger print would complicate that message, particularly if core PPI comes in well above expectations. Components of the producer-price report also feed into calculations for the Personal Consumption Expenditures (PCE) price index — the inflation measure the Federal Reserve monitors most closely — meaning an upside surprise could shift expectations around the Fed's preferred gauge.
This matters for Bitcoin because the cryptocurrency has increasingly traded in step with traditional risk assets such as equities during major economic data releases, with market participants looking to inflation prints for clues about the trajectory of Fed policy and liquidity conditions. This macro test arrives with Bitcoin already pressing against a major technical level, leaving little room for the market to absorb a surprise without testing one side of its current trading range.
Bitcoin Sits at Last Major Daily Support
At the time of writing, BTC was trading near $63,800. The primary support area directly underneath the current price is formed by the 50-day Simple Moving Average (SMA) at approximately $63,400 and the 0.236 Fibonacci retracement level at $63,600.
This confluence represents the last significant daily-chart support cluster before the July swing low in the $57,500–$57,700 range. While minor reaction levels may emerge in between, the chart shows no comparable overlap of Fibonacci and moving-average support before that zone.
On the upside, resistance is concentrated around $67,200–$67,300, where the 100-day SMA near $67,200 nearly aligns with the 0.382 Fibonacci retracement close to $67,300. Bitcoin therefore enters the PPI release with both boundaries of its immediate range clearly defined.
How PPI Could Shape the Next Move
A softer PPI print would align with the direction set by Wednesday's CPI data and could give buyers additional rationale to defend current support levels. If the market interprets both reports as evidence that inflation pressures are easing, BTC could potentially move back toward the $67,200 resistance area.
A hotter-than-expected report, however, would arrive at a technically unfavorable moment. Stronger producer inflation — particularly in the core reading — could reignite concerns that price pressures remain persistent even as headline CPI cools. If that outcome pushes Treasury yields or the US dollar higher, Bitcoin would face macroeconomic pressure while already resting on its primary nearby support. A decisive break below that support could quickly shift the chart into a more defensive configuration, with substantially less technical structure beneath the current price.
A print in line with expectations might leave the overall setup largely unchanged. While Wednesday's CPI data would still lean softer, the absence of a second inflation surprise might give traders little reason to push BTC decisively through either side of the range immediately.
For now, the chart presents an unusually clean picture: support near $63,500, resistance near $67,200, and the PPI release arriving directly between them.
Disclaimer: This article is for informational purposes only and does not constitute financial or investment advice. Cryptocurrency markets are highly volatile, and readers should conduct their own research before making investment decisions.
