Bitcoin Holds Key Support While Historical Cycle Models Signal Further Downside Risk
Key Takeaways
- •Bitcoin is retesting a confluence of support at the 0.236 Fibonacci retracement near $63,600 and the 50-day simple moving average near $63,400 after being rejected at descending channel resistance.
- •All three major moving averages—the 50-day, 100-day, and 200-day—are declining and positioned above the current price, a configuration consistent with sustained bearish momentum.
- •CryptoQuant's halving-to-bottom cycle analysis indicates the 2024 cycle has not yet reached the time window in which previous cycles found their lows, suggesting downside risk persists.
- •Glassnode data shows the current 49% drawdown from peak is the mildest on record by depth, but prior bear markets lasted approximately one-third longer before reaching their bottoms.
- •A daily close below $63,400 would invalidate both the Fibonacci and 50-day average support simultaneously, leaving the lower channel boundary as the next downside target.
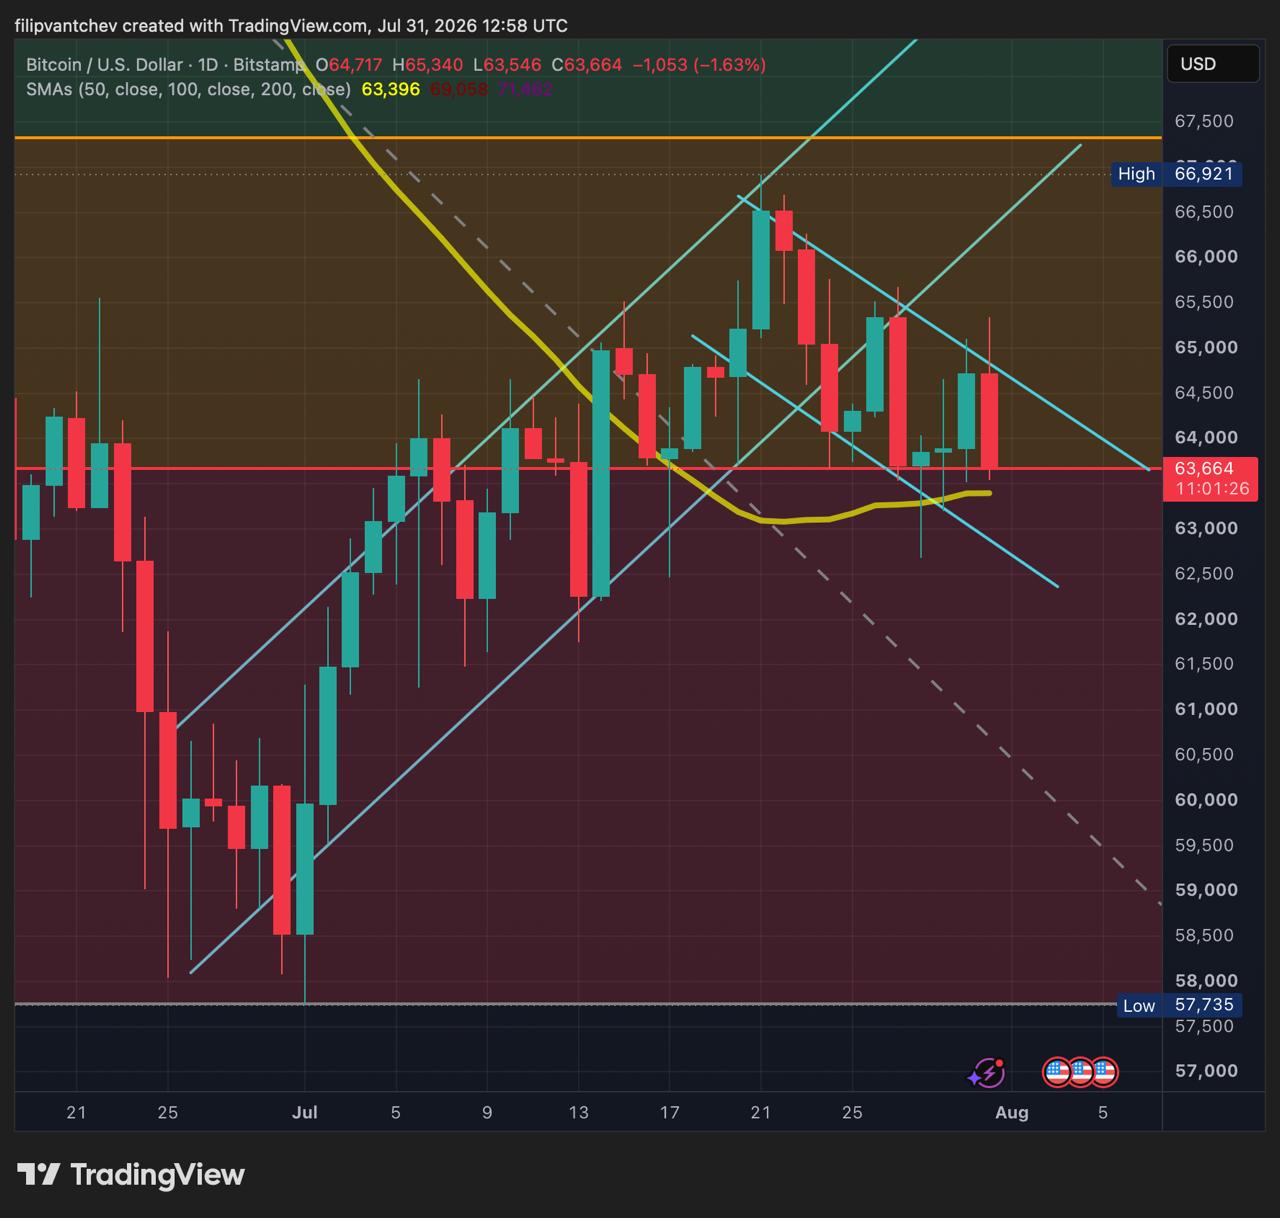
Bitcoin's recent high remains well below the $66,900 peak established ten days earlier, extending a pattern of lower highs that has characterized the past two weeks of price action.
Rejected at Channel Resistance, Retesting the Floor
The succession of descending peaks has formed a channel whose upper boundary has rejected every rally attempt since the $66,900 high. Filip Vantchev, owner of Coindoo, described the setup on X: BTC was "rejected at the descending channel resistance and is now retesting the 0.2 Fib and 50 SMA – a strong support confluence."
"Bulls need to defend this level," Vantchev wrote. "If they don't, the lower boundary of the channel becomes the next downside target where we can see a support. If the current support holds we can see another breakout attempt of the descending channel resistance line."
Two independent technical markers sit approximately $200 apart in this zone. The 0.236 Fibonacci retracement — a shallow pullback level derived from the Fibonacci ratio sequence that traders use to identify potential support zones — measured from the $57,750 low to the $66,900 high, runs near $63,600. The 50-day simple moving average, one of the most widely monitored trend-following indicators, sits at $63,400.
Today's session low reached $63,550, briefly pushing price through both levels before buyers stepped back in. That initial test held, though the daily candle had not yet closed, making the defense provisional.
The 100-day average sits near $69,050 and the 200-day at $71,460 — roughly 8% and 12% overhead respectively — with both sloping downward. With the 50-day below the 100-day and the 100-day below the 200-day, and all three declining, the arrangement is consistent with sustained bearish momentum rather than a transient dip.
Two Cycle Models Point to More Downside Ahead
Separate analyses published on July 31 reached a similar conclusion through different methodologies.
A CryptoQuant analysis by contributor Rei Researcher normalized the price path from each halving to the eventual cycle low and compared the current cycle's position against previous ones. Bitcoin's protocol cuts the block reward miners receive in half roughly every four years — events that occurred in 2012, 2016, 2020, and 2024 — and each prior halving has been followed by a multi-year price cycle. By that measure, the 2024 cycle has not yet reached the window in which the 2016 and 2020 cycles found their floors.
"For now, the cycle data only suggests that downside risk remains," the analysis states. "It is still too early to conclude that a bottom has formed."
Glassnode arrived at a related conclusion from a different angle. The firm's chart tracks drawdown from the all-time high across four cycles, with the current cycle sitting 49% below its peak.
"By depth, it is the mildest on record so far," Glassnode posted on X. "By the clock it isn't finished: prior bear markets ran about 1/3 longer before reaching the lows."
Every previous bear market bottomed at a drawdown far deeper than 49%, and each took roughly a third more time than the current cycle has elapsed. Both depth and duration indicators point in the same direction.
These methods share a common limitation, however. Three prior cycles represent a thin statistical sample, and both approaches require choices about scaling and start dates that other analysts may handle differently. What they provide is an analytical frame rather than a definitive forecast.
That frame affects how to interpret a defended support level. If the cycle has already bottomed, $63,400 holding looks like the foundation of a recovery. If it has not, the same price action may simply represent a pause. Determining which scenario applies is only possible in hindsight, which is why the convergence of two models matters less as a prediction and more as a reason to approach any bounce with caution.
Potential Scenarios
Bitcoin currently sits on two overlapping supports following a rejection at channel resistance, with all three major moving averages positioned overhead. The $69,050 and $71,460 averages would provide a more convincing signal of trend change, yet both continue to slope downward. On that basis, a hold at current support appears more consistent with a defensive outcome than the beginning of a reversal.
Upside scenario: A daily close above $63,600 would keep the floor intact and bring the channel's upper boundary back into play. A decisive break above that line would end the sequence of lower highs established since the $66,900 peak.
Downside scenario: A close below $63,400 would remove both the Fibonacci marker and the 50-day average simultaneously, leaving the lower channel boundary as the next zone where buyers would have a defined basis to act.
Disclaimer: This article is for informational purposes only and does not constitute financial or investment advice. Technical levels can fail, and cycle models describe historical patterns rather than predict outcomes.
Methodology: Price levels, moving averages, and Fibonacci retracements are derived from the BTC/USD daily chart on Bitstamp, dated July 31, 2026, with the session still open at the time of writing. The channel and support analysis is attributed to Filip Vantchev's published post on X. The cycle-bottom model is from CryptoQuant contributor Rei Researcher and represents one analyst's interpretation of normalized halving-to-bottom price paths.

