Bitcoin Slips to $63,000 as Key Support Fails and Market Sentiment Hits Record Low
Key Takeaways
- •Bitcoin confirmed a technical breakdown by closing below the convergence of its 50-day SMA near $63,370 and the 0.236 Fibonacci retracement near $63,620 on July 31.
- •The price remains trapped within a descending channel from the July 21 high, with the next major support zone around $62,100 where buyers have previously intervened.
- •Santiment recorded a bullish-to-bearish comment ratio of 0.58, the lowest positive-to-negative reading since its modern social sentiment monitoring began.
- •Reports of a Coldcard firmware exploit renewed concerns about hardware wallet security and self-custody risk across the cryptocurrency ecosystem.
- •The next technically significant signal will come from either a daily close back above the former support band or a breach below the $62,100 level.
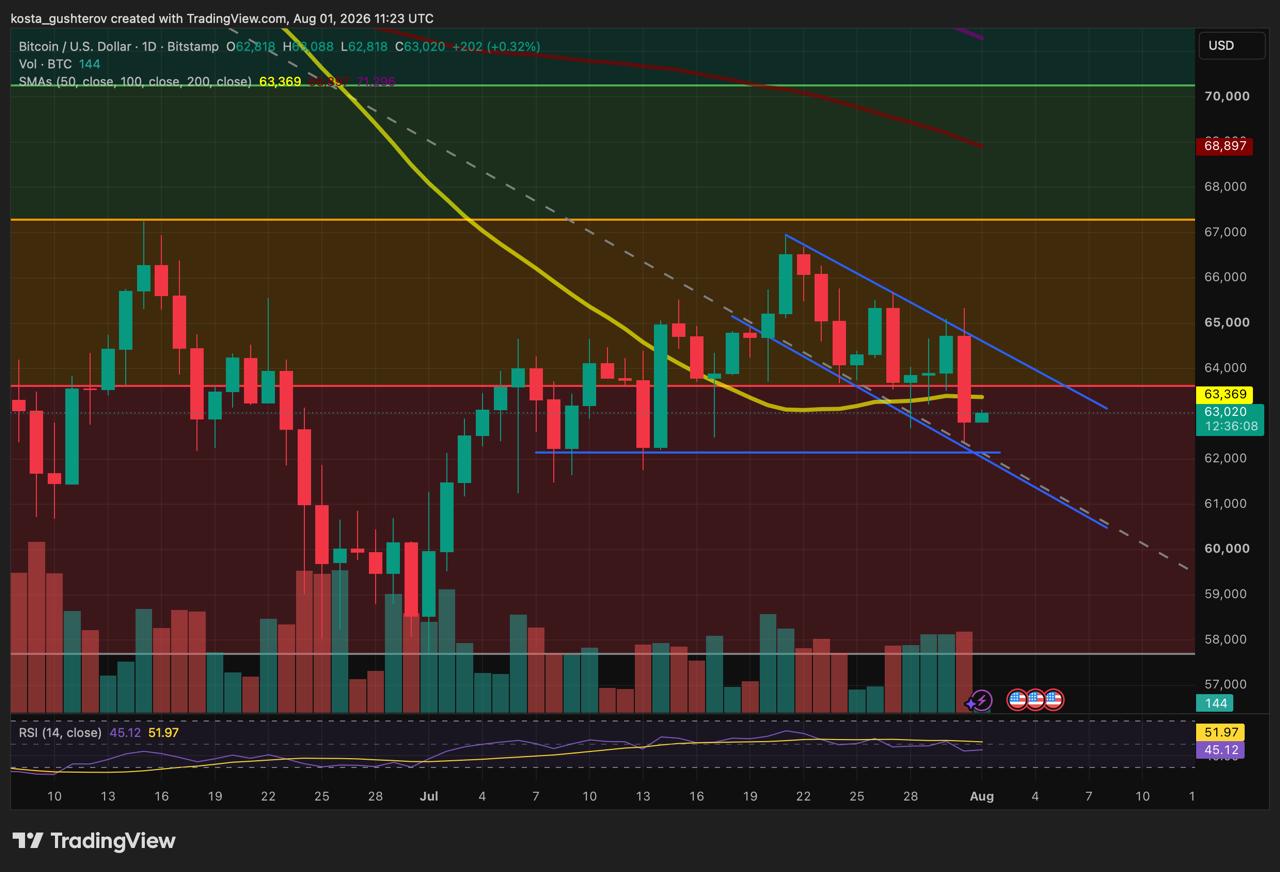
Bitcoin is trading near $63,000 after a critical support zone failed to hold through the July 31 daily close, confirming a breakdown that had been flagged in prior technical analysis.
Buyers initially stepped in around the convergence of the 50-day simple moving average and the 0.236 Fibonacci retracement level, but Bitcoin ultimately closed the session below both markers. The 50-day SMA is one of the most widely tracked trend indicators among active traders, and a daily close beneath it often draws attention as a sign of weakening short-term momentum.
Support Zone Fails at the July 31 Close
The 50-day SMA currently sits near $63,370, while the Fibonacci retracement rests slightly higher at approximately $63,620. Because these two levels are in close proximity, they effectively function as a single resistance zone rather than separate barriers. A brief rebound into this range would not repair the breakdown — Bitcoin would need to register a daily close above both levels to invalidate it.
Price action also remains confined within a descending channel established from the July 21 high, with its pattern of lower highs still intact. Descending channels are commonly associated with a gradual shift in supply-demand balance, where sellers exert incremental pressure at each successive rebound. The channel's lower boundary is converging toward horizontal support around $62,100 — an area that previously halted pullbacks on July 9 and July 14, indicating that buyers have historically responded there.
A daily close below $62,100 would breach both the horizontal floor and the lower channel boundary simultaneously. The current chart structure does not reveal another clearly defined support level immediately beneath that zone.
Bearish Commentary Reaches Record Low Ratio
Santiment recorded 0.58 bullish Bitcoin comments for every bearish comment across the social platforms it tracks, describing the figure as the lowest positive-to-negative ratio since its modern monitoring began.
The reading followed reports of a Coldcard firmware exploit, which renewed concerns about self-custody security. Hardware wallets are widely regarded as the safest option for long-term cryptocurrency storage, yet the incident demonstrated that even established devices can contain software vulnerabilities. Such incidents have periodically surfaced across the hardware wallet ecosystem, reinforcing that firmware integrity is an ongoing concern rather than a one-time event.
Binance founder Changpeng Zhao also addressed the issue, cautioning that no storage method is entirely free of risk:
Zhao's remarks underscored the broader anxiety triggered by the Coldcard report. While self-custody eliminates reliance on a centralized exchange, it does not eradicate technical risk. Distributing funds across multiple wallets may reduce exposure to a single point of failure, though this approach also introduces additional devices, backups, and recovery phrases that users must manage and secure.
The sentiment ratio offers context for the prevailing market mood but should not be interpreted as a directional trading signal. It reflects a single day of data, and extreme negativity can materialize during both sustained downturns and the late stages of a sell-off. Some market participants track social sentiment as a contrarian input, though a single reading alone is insufficient to confirm any directional thesis.
The next technically significant signal would emerge from either a daily close back above the former support band or a break below $62,100.
Disclaimer: This article is for informational purposes only and does not constitute financial or investment advice. Technical indicators and social sentiment data do not guarantee future price performance.
Methodology: Analysis is based on the BTC/USD daily Bitstamp chart dated August 1, 2026, incorporating the 0.236 Fibonacci retracement, 50-day SMA, horizontal support, and descending channel. Sentiment data is sourced from Santiment's August 1 analysis of positive and negative Bitcoin commentary across tracked social platforms.

