Bitcoin's Weakening MACD Momentum Signals Potential Pullback Risk Below $67K Resistance
Key Takeaways
- •Bitcoin's recovery has repeatedly stalled at the $65,000 to $65,200 resistance zone, with sellers actively defending the level despite a pattern of higher lows on the 4-hour chart.
- •The $67,000 region represents a critical barrier because it coincides with the cost basis of newer whale holders, who could generate significant selling pressure if they exit positions at breakeven.
- •A bearish MACD crossover combined with below-average volume indicates that bullish momentum is weakening and may lead to consolidation or a short-term retracement.
- •Immediate technical support rests at $64,000, with additional support zones at $63,000 to $63,300 and the Binance user deposit cost basis near $61,500.
- •On-chain data identifies miner cost bases around $51,000 as a deeper macro-level support, historically serving as a floor where miners reduce selling or accumulate during major corrections.
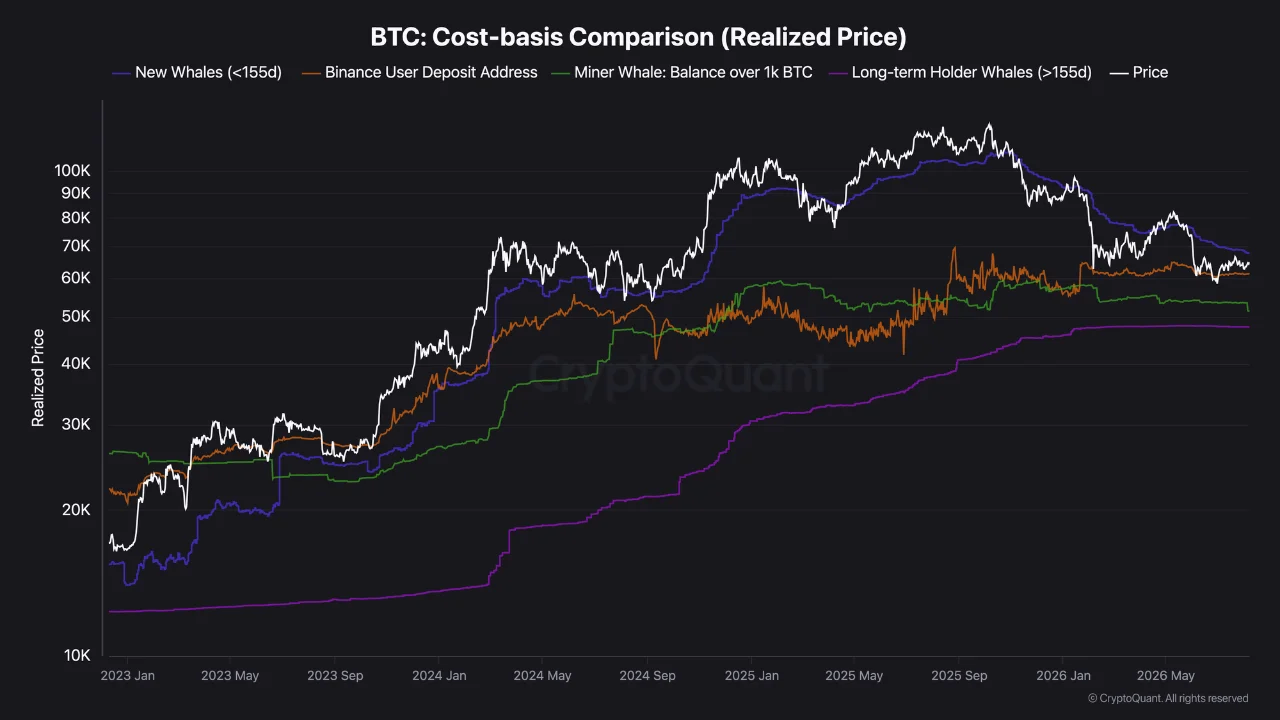
Bitcoin is approaching a decisive technical and on-chain crossroads as its latest recovery loses momentum near the $65,000 level. Resistance at $65,200 and $67,000 will likely determine whether bulls can extend the rally or whether another pullback is triggered. On-chain cost-basis data also points to deeper support around $51,000 if selling pressure were to accelerate across the broader market.
Bitcoin Faces a Critical $67K Cost-Basis Barrier
Bitcoin's recent recovery has brought the market back into a key supply zone. After dropping toward $62,500–$63,000 in late July, BTC has gradually clawed back losses. The 4-hour chart shows a sequence of higher lows, suggesting that buyers remain active in the market.
However, the recovery has stalled around the $65,000–$65,200 range. Multiple candles have rejected this area, indicating that sellers are actively defending the level. The broader trading range remains concentrated between approximately $63,000 and $67,000.
A decisive 4-hour close above $65,200 could strengthen the bullish setup. Such a move would bring $66,000 into focus before Bitcoin tests the major swing high around $66,800–$67,000.
The $67,000 region carries additional significance because it aligns with the cost basis of newer whale holders, making it more than a conventional technical resistance level. New whale holdings accumulated around this price represent a potentially significant source of overhead supply. If holders who bought near $67,000 use the current recovery to exit at breakeven, Bitcoin could face renewed selling pressure.
This dynamic raises the possibility of a bull trap, where BTC briefly breaks above resistance before falling back below it. Meanwhile, the Binance user deposit cost basis near $61,500 has emerged as an important near-term support zone. Previous dips below this level attracted buyers and produced relief rebounds.
Nevertheless, the latest buying activity appears less convincing. Subdued volume during the recovery suggests that buyers have not yet demonstrated sufficient conviction to support a sustained breakout.
MACD Warning Keeps Bitcoin Bulls on Alert
Technical momentum provides another reason for caution. The MACD, or Moving Average Convergence Divergence, is one of the most widely used trend-following indicators in crypto trading. It compares two moving averages of price to gauge momentum direction and strength, making bearish crosses like the one now forming closely watched signals across derivatives and spot markets.
The MACD remains above the zero line, indicating that the broader momentum structure has not completely turned bearish. However, the MACD line at 184.57 has fallen below the signal line at 223.06.
The histogram has also slipped slightly into negative territory at -38.48. Together, these signals suggest that bullish momentum is fading. Bitcoin could therefore enter a period of consolidation or experience a short-term retracement before attempting another breakout.
Source: CryptoRank
The immediate technical level to monitor is $64,000. As long as BTC holds this area, the higher-low structure remains intact. A successful defense could allow bulls to challenge $65,200 again and eventually target the $66,000–$67,000 range.
However, a sustained move below $64,000 would weaken the short-term structure and could expose $63,000–$63,300, which currently represents the key technical support zone.
Beyond that, the on-chain cost-basis picture becomes increasingly significant. Miner cost bases are clustered around $51,000, while long-term holders provide another major layer of support. The gap between the long-term holder cost-basis supply and the current Bitcoin price is approximately $17,700, implying potential downside of around 26% from current levels if the market were to enter a much deeper correction.
The miner region around $51,000 could consequently serve as a formidable defensive line in a final-bottom scenario. Historically, Bitcoin miner cost bases have functioned as macro-floor indicators because miners reduce selling or accumulate when prices approach their operational breakeven. For now, Bitcoin remains cautiously bullish-to-neutral.

