Bitcoin Falls 1.8% as Iran Strike Report Pushes Oil Above $100
Key Takeaways
- •Bitcoin traded near $82,686 on Bitstamp after a 1.8% decline in 24 hours, extending a pullback that began on October 7 with a drop toward $84,000 as leveraged long positions were unwound.
- •The Atlantic reported that the White House asked the Pentagon to develop options for possible strikes against Iran, though the report did not say a military operation had been approved.
- •Brent crude traded above $101 a barrel on October 8 as shipping attacks kept Middle East export routes and supply concerns in focus.
- •U.S. 10-year and 30-year Treasury yields reached fresh 24-year highs as oil topped $100, raising the opportunity cost of holding non-yielding assets such as Bitcoin.
- •A key support cluster sits between $80,400 and $80,550, where the 0.236 Fibonacci retracement at $80,430 overlaps with the 50-day simple moving average near $80,550, while a sustained close below could bring the $76,100 level into view.
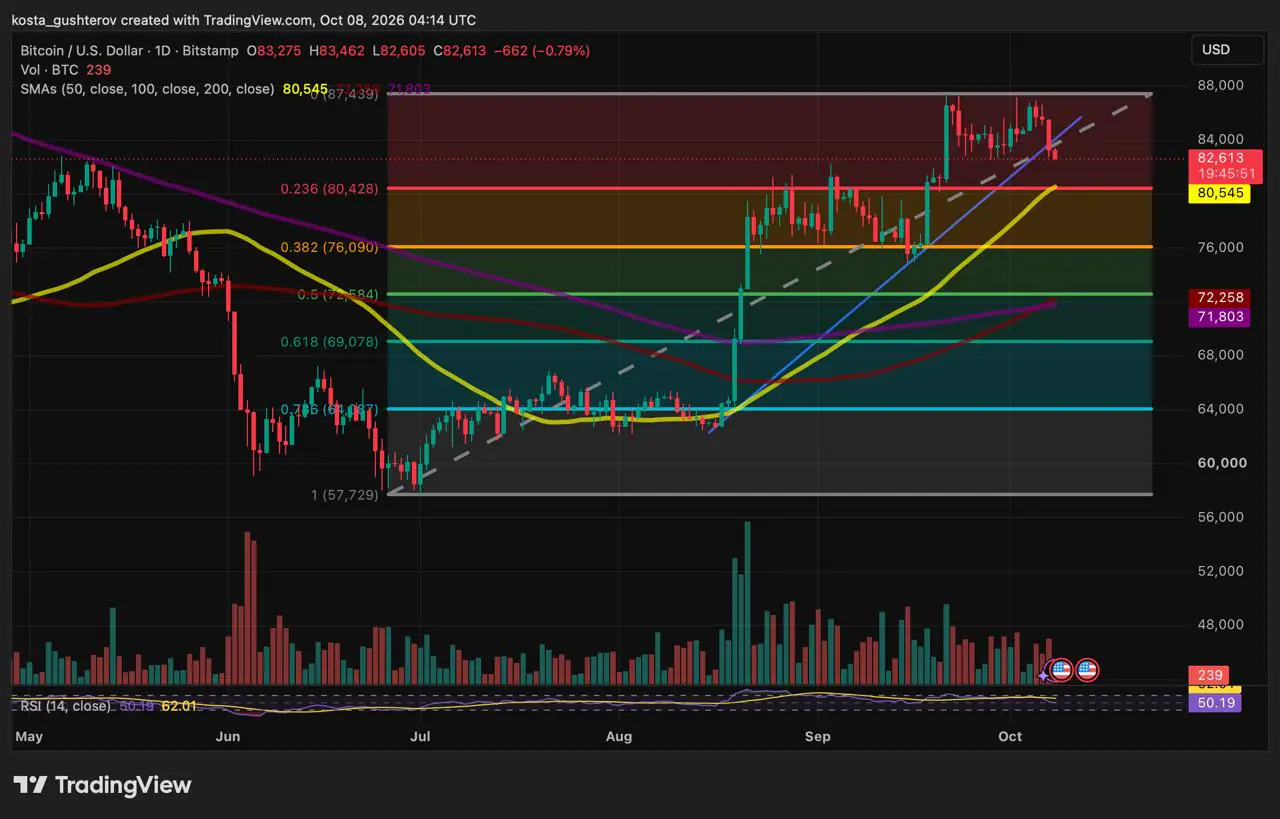
Bitcoin fell 1.8% over the past 24 hours, extending a broad retreat that began on October 7, when the token dropped toward $84,000 after buyers failed to sustain higher prices. That earlier crypto-market pullback hit major tokens as leveraged long positions were unwound, and the latest move has pushed Bitcoin further below the levels it had recently struggled to hold. Oil above $100 a barrel and fresh multi-decade highs in long-dated U.S. Treasury yields formed the macro backdrop to the slide.
Oil Report Puts Inflation and Treasury Yields Back in Focus
The decline came after The Atlantic reported that the White House had asked the Pentagon to develop options for possible strikes against Iran. The report cited administration officials and did not say that a military operation had been approved.
Oil nevertheless moved higher as traders reassessed the prospect of further disruption in the region. Reuters reported that Brent traded above $101 a barrel on October 8, extending the energy-risk premium that has persisted through the latest Middle East tensions. The news agency attributed the move to persistent supply concerns, with shipping attacks keeping the region's export routes in focus.
More expensive crude can keep inflation expectations elevated, prompting investors to demand higher returns from longer-dated government debt. That backdrop has already weighed on financial markets: U.S. 10-year and 30-year Treasury yields reached fresh 24-year highs during the previous session as oil topped $100, according to Reuters. For assets such as Bitcoin that produce no cash flow, higher long-term yields raise the opportunity cost of holding the position, which is why bond-market moves often set the tone for risk appetite well beyond crypto.
Bitcoin was also exposed to its own spot flows, leverage and profit-taking. The new report added another source of caution by bringing oil, inflation expectations and Treasury yields back into the same conversation. During the previous flare-up, Bitcoin's reaction to Iran risk showed how quickly an oil move can shift traders' attention from crypto-specific demand to borrowing costs and inflation.
Stronger Support Sits Below the Latest Price
At 04:07 UTC, Bitcoin traded near $82,68 on Bitstamp, down about 0.71% from the day's opening price, while CoinMarketCap recorded a 1.8% decline over the previous 24 hours.
Bitcoin was also trading under the rising trendline that has followed its rebound from September's low. A daily close below that line would weaken the short-term slope of the recovery, but a more substantial chart test sits lower, where two separate technical references overlap.
The key cluster lies between $80,400 and $80,550. The $80,430 level marks the 0.236 Fibonacci retracement of Bitcoin's rise from roughly $57,700 to $87,440, while the 50-day simple moving average sits near $80,550, leaving both measures inside the same narrow area. Fibonacci retracements are chart levels derived from standard ratios of a prior move, and moving averages track the average price over a set period — two of the most widely used references for framing where a pullback may attract renewed interest. The retracement shows how much of Bitcoin's recent advance has been returned, and the 50-day average reflects its recent trading trend. Their overlap gives the range more weight than the rising trendline alone.
A Daily Close Around the Range Will Shape the Next Move
If price reaches the support cluster and closes back above it, the pullback would remain contained within the recovery. Momentum has already cooled, however: the daily relative strength index — a gauge that compares the pace of recent gains and losses — stood near 50, below its smoothing line around 62. That shows the September advance has lost pace without reaching an oversold extreme.
A sustained close below the range would make the 0.382 Fibonacci retracement near $76,100 the next lower reference. It is a chart level to monitor rather than a prediction that Bitcoin must reach it. The 100-day and 200-day simple moving averages, near $72,260 and $71,800, form a much deeper area and offer little guidance on the immediate reaction.
Oil, Yields and Bitcoin's Support Now Share the Same Test
Oil prices, Treasury yields and Bitcoin's reaction at the support cluster will now remain closely linked in traders' focus. Follow-up reporting on the Pentagon planning request, along with the next readings on crude and long-dated yields, would give the clearest signal of whether the macro pressure builds or eases. A calmer energy market would remove one source of pressure. A sustained break beneath the range would show that the macro concern has reached a market already losing short-term momentum.
This article is for informational purposes only and does not constitute investment or trading advice. Technical levels are approximate and historical market relationships do not guarantee future price movements.

