Michael Saylor Posts 'Feeling ₿ullish' 80 Minutes Before Bitcoin Drops 5%: Does Strategy's Chairman Have the Worst Timing on X?
Key Takeaways
- •Michael Saylor posted "Feeling ₿ullish" on X with bitcoin at $79,541, but the cryptocurrency dropped to $75,826 within three hours as a Wall Street chip-stock sell-off spread to crypto markets.
- •The equity-led decline saw the Philadelphia Semiconductor Index close down 12.2%, with bitcoin touching $75,208 late Thursday and trading near $75,790 by Friday morning, a 4.7% drop from the time of the post.
- •Strategy purchased 811 BTC between October 26 and November 1 at an average price of $80,846, bringing total holdings to 849,327 BTC, roughly 4% of bitcoin's 21 million supply cap.
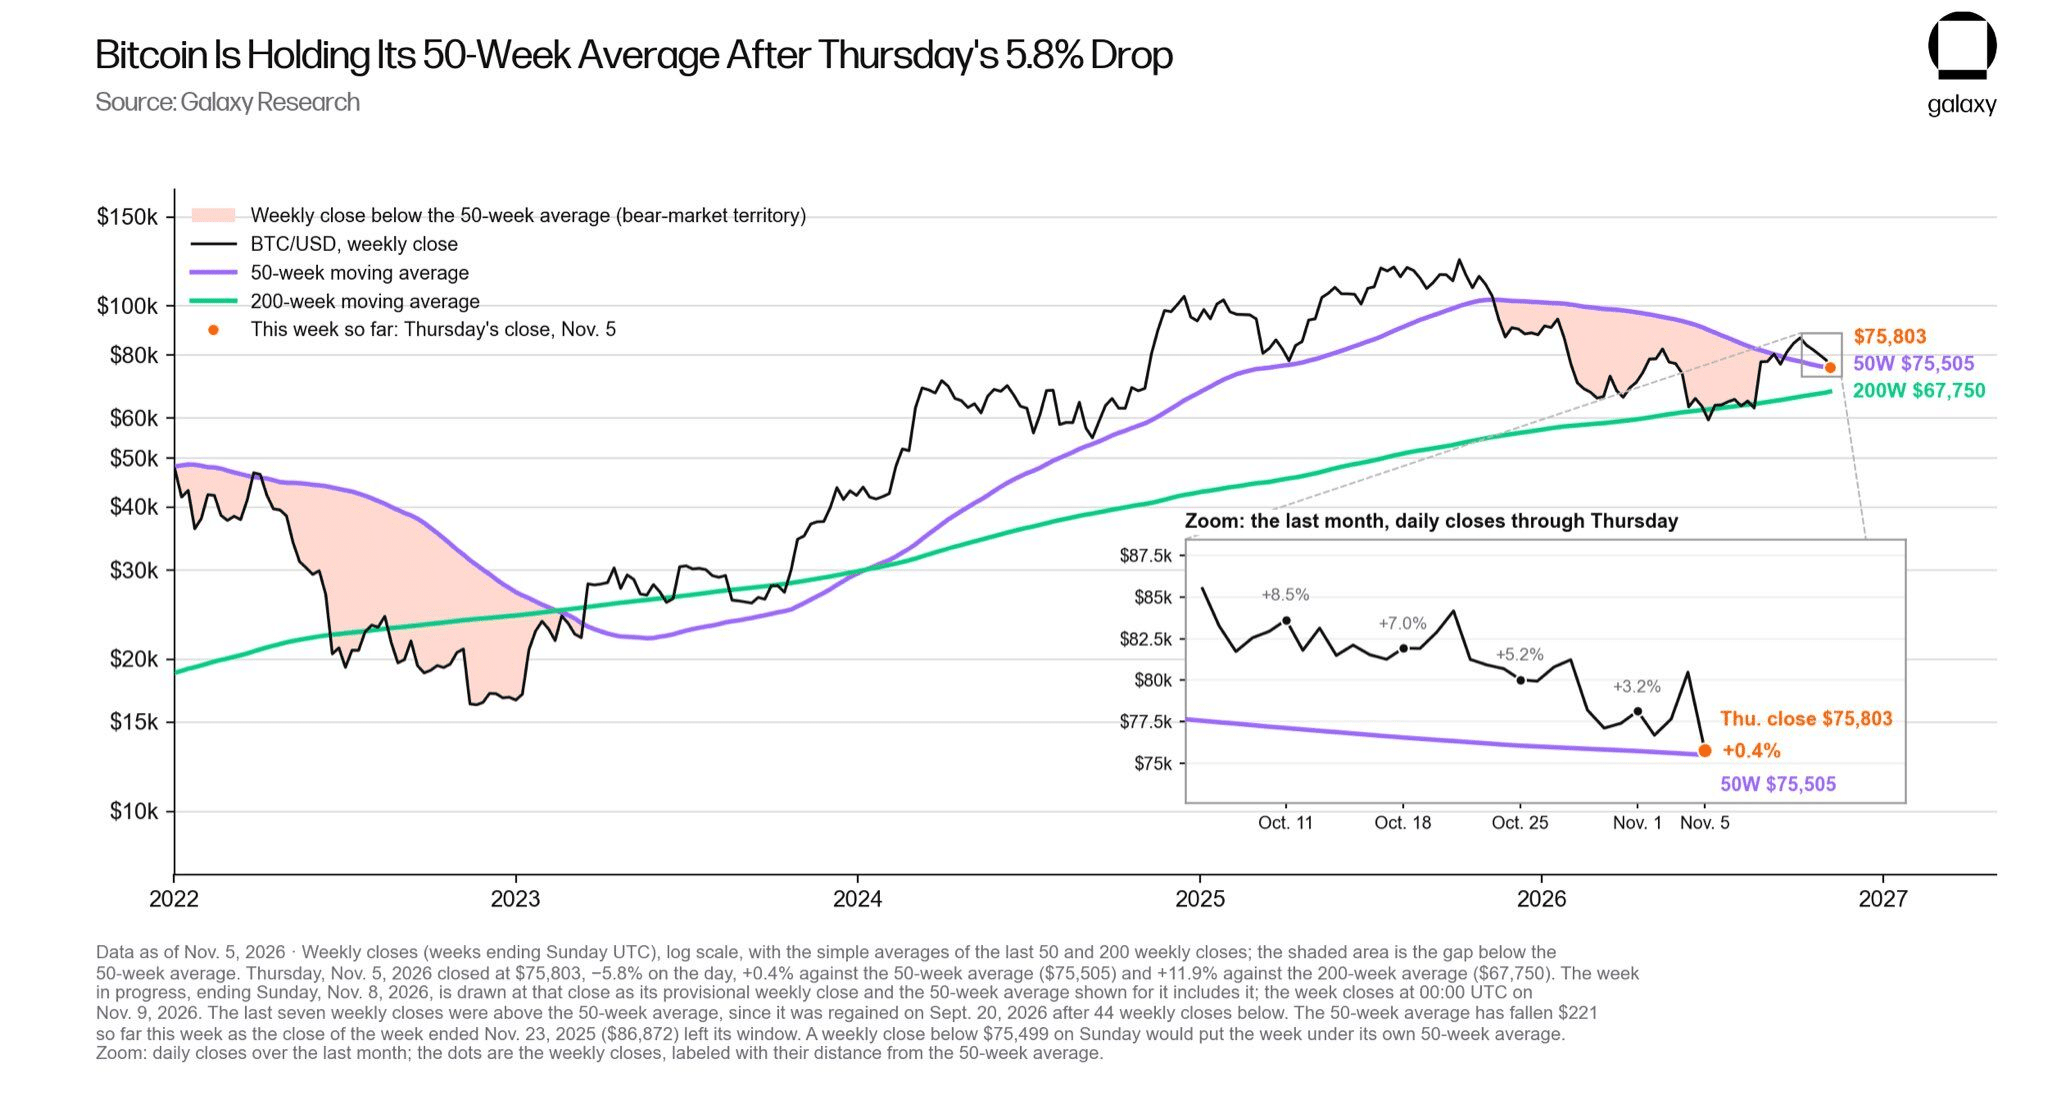
- •Galaxy Research places bitcoin's 50-week moving average at $75,505 and treats any weekly close below that line as bear-market territory, with a Sunday close under $75,499 putting bitcoin back beneath it.
- •The 50-week moving average now sits just $54 above Strategy's average purchase price of $75,451, placing the largest corporate bitcoin holder's cost basis in the same narrow price zone as the bull-bear divide.
Strategy chairman Michael Saylor posted "Feeling ₿ullish" on X at 13:08 UTC on Thursday, November 5, with bitcoin (BTC) changing hands at $79,541. Within three hours, the cryptocurrency had fallen to $75,826 as a Wall Street chip-stock crash spilled over into crypto markets. Few posts have aged faster.
The accompanying image shows Saylor in a dark suit, standing in front of a giant bull's shadow. By Friday morning, the post had drawn roughly 410,000 views and 10,000 likes, while bitcoin traded near $75,790 — down 4.7% from the moment he hit send.
Feeling ₿ullish. pic.twitter.com/kN4P1h0QEo — Michael Saylor (@saylor) November 5, 2026
The drop originated in equities. Wall Street opened at 14:30 UTC, and the Philadelphia Semiconductor Index went on to close down 12.2%. Bitcoin fell from $78,288 to $75,568 in the 15:00 UTC hour alone and touched $75,208 late on Thursday.
The irony is real, but so is the base rate. Saylor posts something bullish almost every day, so some of those posts will always land right before a drop.
Strategy — the software company, formerly known as MicroStrategy, that holds more bitcoin than any other corporation — bought 811 BTC between October 26 and November 1 at an average of $80,846, per its official purchase disclosures, lifting total holdings to 849,327 BTC at an average cost of $75,451. That stockpile amounts to roughly 4% of bitcoin's capped 21 million supply, and because the company reports holdings through weekly purchase disclosures, its next update will be the first to cover the week containing Thursday's drop. At $75,790, bitcoin is only 0.4% above the average price Strategy paid for every coin it owns.
Is Bitcoin Holding Its 50-Week Average?
Just about. Galaxy Research puts bitcoin's Thursday close at $75,803, 0.4% above its 50-week moving average at $75,505.
Galaxy shades every weekly close below that line as bear-market territory. Bitcoin spent 44 straight weeks under it before reclaiming the level on September 20, and it has closed the last seven weeks above.
The 50-week average is also falling — by $221 so far this week. A weekly close below $75,499 on Sunday would put bitcoin back beneath it. One caveat: this week's candle does not close until 00:00 UTC on Monday, so Thursday's reading can still change in either direction.
That line now sits just $54 above Strategy's average purchase price of $75,451, placing the largest corporate holder's cost basis and the bull-bear divide Galaxy tracks within the same narrow price zone.
BTC Price Analysis: The Weekly Chart
On the weekly chart, bitcoin sits right on its 50-week simple moving average near $75,500, a level that also matches the 50% Fibonacci retracement of the entire 2023–2025 rally.
The 50-week exponential moving average at $78,468 marks the first resistance, followed by the swing high at $82,850. Below the average, the weekly swing low at $74,508 comes first, then the 200-week moving average at $67,765.
Saylor will probably post again before Sunday's close. Whether the bull shows up on the chart, however, depends on the $75,500 line — not on his feed.

