Bitcoin Risks Drop to $71,000 as Rounded-Top Pattern Takes Shape
Key Takeaways
- •A four-hour close below $76,000–$76,300 could confirm the rounded-top pattern and imply a measured downside target near $70,900–$71,000.
- •Bitcoin’s four-hour RSI was about 54.5, while its 20-, 50-, and 100-period exponential moving averages were closely grouped.
- •Sustained trading above $79,500–$80,000 would weaken the bearish setup, while a break above approximately $81,500 would largely invalidate it.
- •September data showed positive demand for Bitcoin perpetual futures but negative spot demand, leaving overall demand below zero.
- •Derivatives-led buying may be vulnerable to rapid selling and higher volatility if leveraged traders close positions or face liquidations.
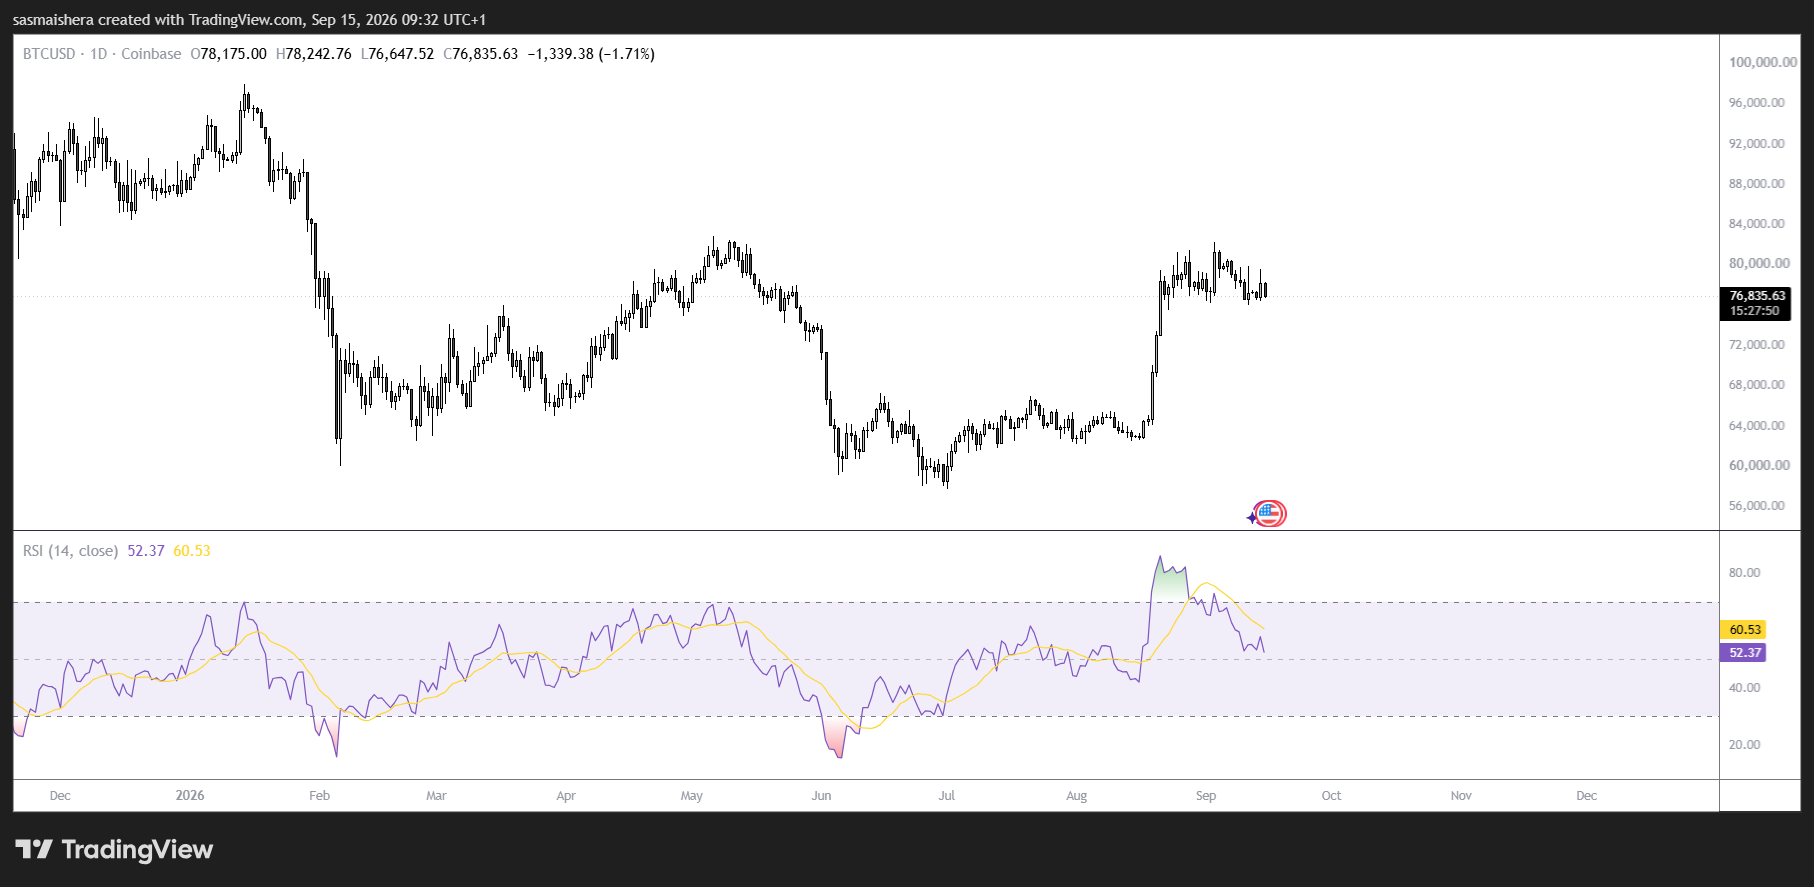
Bitcoin may decline toward $71,000 if a potential rounded-top pattern on its four-hour chart is confirmed by a decisive break below the $76,000 support level. The pattern has emerged after BTC rallied from approximately $63,000 in mid-August to the $80,000–$81,500 region.
Bullish momentum has since weakened. Bitcoin’s price has gradually curved lower, creating the dome-like structure associated with a rounded top. Weak spot-market demand is adding to the downside risk, even as demand for Bitcoin perpetual futures remains positive.
Bitcoin’s rounded top puts $71,000 in focus
Bitcoin’s potential rounded-top formation developed during its recovery from the August lows. The cryptocurrency was trading near $76,870 on Monday, September 15, and remained above the key support zone between $76,000 and $76,300. This region effectively serves as the neckline of the bearish chart formation.
A decisive four-hour candle close below that zone could confirm the pattern and increase the likelihood of a deeper correction. The distance between the formation’s peak and neckline is approximately $5,000 to $5,300. Subtracting that range from a potential breakdown near $76,000 produces a technical downside target between $70,900 and $71,000. This is a chart-based measured move, not a guarantee that Bitcoin will reach the target.
The $76,000–$76,300 area is therefore the critical level for the pattern. Until Bitcoin moves decisively away from it, the chart formation remains a potential setup rather than a confirmed breakdown. A four-hour move below the zone would provide confirmation to watch for, while a continued hold would leave the bearish pattern unresolved.
Technical indicators point to market indecision
Bitcoin’s four-hour Relative Strength Index was near 54.5, indicating broadly neutral momentum rather than conditions that were strongly overbought or oversold.
BTC was also trading around its 20-period, 50-period, and 100-period exponential moving averages. The clustering of these indicators reflects the continuing struggle between buyers and sellers.
A sustained recovery above the $79,500–$80,000 range would weaken the rounded-top scenario. A breakout above the recent highs near $81,500 would largely invalidate the bearish formation and restore the case for further gains. Until then, the $76,000 support remains the most important level to monitor.
Bitcoin’s underlying demand profile provides limited support for the bullish outlook. CryptoQuant’s 30-day demand-growth data shows that demand in the perpetual futures market remained positive during September, while spot demand stayed negative.
As a result, Bitcoin’s overall demand remained below zero despite continued activity from derivatives traders. This divergence suggests that leveraged futures positions account for much of the recent buying pressure, rather than investors accumulating BTC directly through the spot market.
Futures-led demand leaves BTC vulnerable
A rally driven primarily by derivatives can be more fragile than one supported by strong spot buying. Futures demand may disappear quickly when traders close leveraged positions or face liquidations during a price decline. If Bitcoin breaks below a significant support level, that process can accelerate selling and increase volatility.
A somewhat similar divergence developed in January and February 2026, when futures demand briefly recovered before overall demand and Bitcoin’s price weakened. The current structure does not guarantee the same outcome. However, without a recovery in spot demand, a confirmed break below $76,000 would make the rounded-top target near $71,000 increasingly relevant.
Source: CoinJournal

