Bitcoin Trades Above Short-Term Holder Cost Basis, but 62% of Recent Coins Sit Underwater
Key Takeaways
- •Bitcoin's roughly 10% decline from its September high has returned the asset to test the True Market Mean, the short-term-holder cost basis, and the 200-day average it reclaimed during the August rally.
- •Only about 38% of short-term-holder supply is in profit, down from more than 97.5% in early October, leaving roughly 62% of recently acquired coins underwater even as price sits above the cohort's average cost.
- •U.S. spot Bitcoin ETFs posted net outflows totaling about $1.16 billion across three sessions, including $643.2 million on October 30, with the November 3 outflow shrinking by roughly 71% but still ending negative.
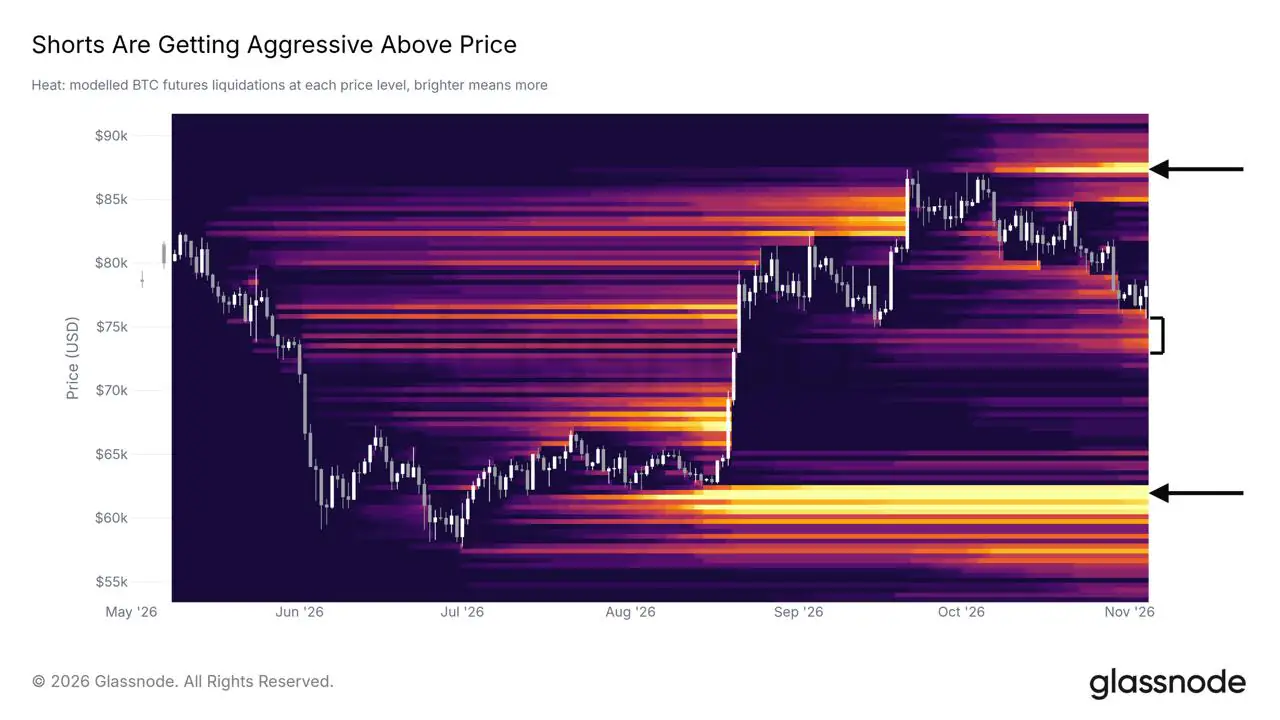
- •Leveraged short positions have built up above price, with the largest liquidation cluster near $87,000, meaning a bounce could reflect short covering rather than genuine new demand.
- •Glassnode characterizes the pullback as a healthy reset within the uptrend, pointing to the market's muted reaction to the October 29 Binance breach, estimated at about $6.3 billion and the largest crypto theft on record.
Glassnode's latest weekly report, titled “Idling at Support” and published November 4, frames the current Bitcoin pullback as a retest of territory the asset reclaimed in August. Read alongside ETF flow data, it describes a market that has worked off much of its forced selling without attracting fresh buyers, while the share of recently acquired coins held at a loss keeps growing. U.S. spot Bitcoin ETF investors, meanwhile, have pulled roughly $1.16 billion across three sessions.
Bitcoin Retests the Levels It Reclaimed in August
Bitcoin's August and September climb lifted it back over several benchmarks it had surrendered after its 2025 all-time high: the 200-day average, the short-term-holder (STH) cost basis, and Glassnode's True Market Mean. The True Market Mean gauges the average acquisition price of actively circulating coins and screens out long-dormant supply, while the STH cost basis runs the same calculation on coins held for less than roughly five months. The 200-day average, by contrast, is a technical trend benchmark computed from past prices rather than on-chain acquisition data.
Those recovered levels are now being probed from above. On November 3, Bitcoin closed just beneath the True Market Mean and slid toward $76,000 overnight as the U.S. midterm count came in, before climbing back over it. Glassnode pegs the retreat from the September high at about 10%.
The more consequential detail lies below price. The STH cost basis sits inside the band where Glassnode still maps leveraged long positions: one marks the cost reference recent buyers watch, the other a zone where leveraged longs would become forced sellers. Because both occupy the same narrow range, a test of the cost basis doubles as a test of whether forced selling reignites.
Longs Were Liquidated First, Then Shorts Piled In
Glassnode's liquidation heatmap, which estimates where leveraged positions would be compelled to close, shows that the slide from the September high triggered many of the long-liquidation levels stacked up during the rally. Liquidations are forced closures that exchanges trigger when a leveraged position's losses exhaust its margin. The long-side exposure still outstanding is concentrated in the band under price, which coincides with the 200-day average.
Positioning above price evolved in the opposite direction. Overhead liquidation levels kept building over the past week even as price fell about 3.5% — a pattern Glassnode ascribes to traders adding shorts on the way down. The biggest overhead cluster sits near $87,000, close to the September high.
That shifts what a bounce would demonstrate. A move toward those levels would push some short sellers to buy back positions, but that buying comes from traders unwinding bets rather than investors adding exposure. A rally powered by short covering could pass for demand on a price chart without registering as demand in ownership data.
How Can Most Recent Supply Be Underwater While Price Tops the Average Cost?
In early October, 97.5% or more of short-term-holder supply was in profit. Glassnode now measures that share at about 38%, leaving roughly 62% of coins held for under five months below their acquisition price — even with Bitcoin trading above the cohort's average cost.
The average and the share in profit answer different questions. A small block of far cheaper coins can pull the average down while a larger block stays underwater. Consider a simplified cohort in which 38% of coins were bought at $60,000 and 62% at $85,000: the average cost comes to about $75,500, below Bitcoin's current price, yet 62% of the supply sits at a loss. Reclaiming the average tells little about how many coins are back to break-even.
Glassnode constructs these cohorts from entity-level on-chain estimates, using a gradual boundary around 155 days and excluding coins held on exchanges. The 38% figure therefore describes a modeled group of coins, not a count of investors. A coin held at a loss has not been sold — but it has become a candidate for sale.
Those candidates form the second side of the market. Holders who bought above the current price recover their capital only if Bitcoin climbs back toward their cost, and some may choose to exit once it does. The data show how fast that supply accumulated: the cohort swung from almost entirely in profit to mostly underwater in roughly a month.
ETF Investors Are Still Redeeming
With forced selling drained and potential sellers multiplying, the open question is who absorbs the supply. U.S. spot Bitcoin ETFs — funds that hold Bitcoin directly and the most visible channel for new traditional money — have not taken on that role. Farside Investors' data show net outflows of $643.2 million on October 30, $398.6 million on November 2, and $115.6 million on November 3, totaling about $1.16 billion across three sessions.
The outflow shrank by roughly 71% on November 3, as small inflows into Bitwise's and Fidelity's funds partly offset about $95 million leaving BlackRock's IBIT. The day still ended negative, meaning what improved was the pace of selling, not the return of buyers.
Glassnode reads the wider picture as money already inside crypto rotating among assets and venues, with traditional investors contributing little. Its previous weekly edition put the average cost basis of U.S. spot ETF holders near $81,500. With Bitcoin below that mark, the aggregate ETF position sits underwater — turning the ETF channel into a second pool of potential break-even supply rather than a source of new demand.
The Case for a Healthy Reset
Glassnode's own interpretation is more constructive. Retests after a breakout are routine, the firm argues, and this pullback has flushed out the excess built at the September high, leaving short-term holders far less stretched than a month ago. Spot volume, according to the report, has held above its pre-rally level.
The market also absorbed the October 29 Binance breach, which the exchange estimated at about $6.3 billion and which ranks as the largest crypto theft on record. Glassnode treats the muted price reaction as a sign of strength and frames a hold of the band below price as a healthy reset within the uptrend that began in August. The shorts added during the decline fit that narrative: traders positioned for further losses are the ones forced to buy if price recovers.
Both readings can hold at once. A cleaner market structure and a missing buyer are separate conditions, and the reset case addresses the first without settling the second. Which matters more for the recovery hinges on whether flow data starts to line up with positioning data.
What Would Settle the Question
These signals do not carry equal weight. Short-term-holder profitability rises mechanically with price, so its recovery would indicate recent holders recouping losses rather than new buyers stepping in. ETF flows are the more independent test, because they track money entering or leaving rather than revaluing coins already held.
Signals that would support the reset reading:
- Daily closes above the True Market Mean through the coming week, without a repeat of the November 3 slip
- Net ETF inflows in most of the next five trading sessions
- Short-term-holder supply in profit back above 50% in Glassnode's next weekly edition
Signals that would undercut it:
- A daily close below the short-term-holder cost basis, placing price inside the long-liquidation band
- Redemptions returning to the scale of October 30
- Short-term-holder profit share falling further in Glassnode's next weekly edition
Farside publishes ETF flows daily while Glassnode refreshes its cohort data weekly, so the buyer side of the question gets tested first.
This article is based on Glassnode's “Idling at Support” report and was originally published by Coindoo.

