Bitcoin Faces Breakout Test as Old Coins Reawaken
Key Takeaways
- •Bitcoin faces overlapping resistance from a descending channel trendline, horizontal level at $64,300, and Fibonacci retracement near $63,500, despite reclaiming its 50-day SMA.
- •Analyst Michaël van de Poppe identifies $85,000 near the 50-week moving average as a broader recovery target, but BTC must first clear its 100-day SMA near $68,466 and 200-day SMA around $70,809.
- •Long-term holder supply has turned lower after reaching an all-time high, indicating that coins inactive for over 155 days are re-entering circulation.
- •Historical intervals between cycle rallies varied widely from eight to seventeen months, making prior patterns informative but unreliable as a precise timetable.
- •The US SEC's approval of spot Bitcoin ETFs in January 2024 has introduced regulated institutional channels that fundamentally differ from the retail-dominated markets of earlier cycles.
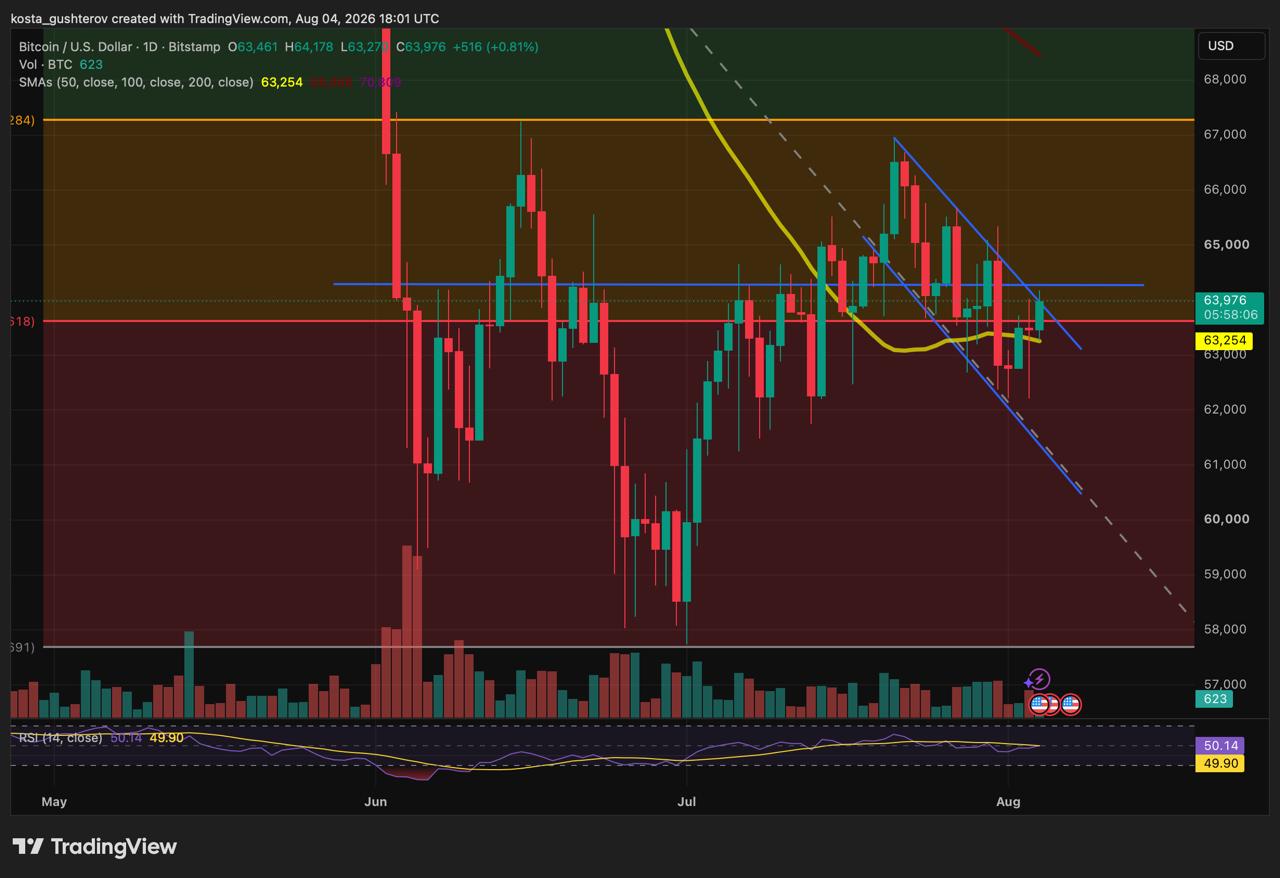
Bitcoin's recovery has run into a congested zone where multiple technical signals converge: the upper boundary of a descending channel, the 0.236 Fibonacci retracement near $63,500, and horizontal resistance around $64,300. BTC currently sits above short-term support but has yet to confirm a decisive break from the downtrend that began in late July.
Key Takeaways
- Bitcoin is pressing against resistance defined by a descending channel and the $64,300 level.
- BTC remains above its 50-day SMA; a rejection here could send price back toward $62,000.
- Analyst Michaël van de Poppe identifies $85,000, near the 50-week moving average, as a broader recovery target.
- Long-term holder supply has begun declining after reaching a record high.
- The on-chain shift turns constructive only if market demand absorbs the older coins re-entering circulation.
Bitcoin Tests a Congested Resistance Zone
The recent move above the 50-day SMA has strengthened Bitcoin's short-term posture, yet price continues to push against the descending trendline and the horizontal barrier just above it. The 50-day SMA is a widely tracked medium-term trend indicator; reclaiming it often signals a potential shift in near-term momentum.
A daily close beyond the channel and $64,300 would clear the immediate obstacle and bring $65,000 into focus. A subsequent pullback that holds above the broken trendline would offer stronger evidence that the move amounts to more than another intraday test.
The daily RSI — a momentum oscillator that measures the speed and magnitude of price changes on a scale of 0 to 100 — hovered near 50, mirroring the indecision visible on the price chart. Momentum has bounced back from its recent weakness but has not tilted decisively in favor of buyers.
If resistance holds, the 50-day SMA near $63,250 becomes the first level to watch. A deeper reversal would expose the recent support zone around $62,000.
Van de Poppe's $85,000 Target Represents a Broader Weekly Outlook
Should Bitcoin push through its current resistance, analyst Michaël van de Poppe anticipates the recovery extending significantly further. In an August 4 market update, he wrote:
"The next leg upwards for Bitcoin will be to the $85,000 area."
Van de Poppe pointed to the 50-week moving average as the primary obstacle near that level. His forecast applies to a wider timeframe than the current daily chart setup. Before $85,000 becomes an immediate technical objective, Bitcoin must still clear its 100-day SMA near $68,466 and its 200-day SMA around $70,809.
The ongoing breakout attempt therefore represents an initial step along that recovery path rather than confirmation that Bitcoin is already on a direct trajectory toward Van de Poppe's target.
Long-Term Holder Supply Begins to Decline
The technical test is unfolding as older Bitcoin starts moving on-chain once again. A CryptoQuant analysis shows that supply attributed to long-term holders has recently turned lower after climbing to its highest level on record.
Long-term holder supply tracks coins that have remained inactive for more than 155 days, the threshold CryptoQuant uses to separate this cohort from short-term holders. Once those coins are spent, they exit the group and become part of the more liquid, active supply.
The decline does not indicate why the coins moved. They may have been sold, transferred between wallets controlled by the same owner, sent to custodians, or deposited on exchanges.
Historically, Bitcoin rallies have frequently coincided with periods in which long-term holders gradually distributed coins while new buyers entered the market. Prices continued climbing when incoming demand was strong enough to absorb the additional supply.
Historical Patterns Do Not Serve as a Fixed Cycle Clock
The CryptoQuant analysis draws a comparison between the latest shift and similar declines in long-term holder supply that preceded later rallies in prior cycles.
The interval between the first and second rallies reportedly spanned eight months in the 2013 cycle, 17 months in 2017, and 16 months in 2021. Roughly 31 months have elapsed in the current cycle.
That wide variation makes the comparison informative as a description of holder behavior, but unreliable as a precise timetable.
Market structure has also evolved. U.S. spot Bitcoin ETFs, approved by the SEC in January 2024, have created a regulated channel for institutional and retail capital flows that did not exist in previous cycles. Alongside larger institutional participants, these vehicles can absorb, hold, and redistribute Bitcoin in ways that differ fundamentally from the predominantly retail-driven markets of earlier cycles.
The decline in long-term holder supply therefore confirms that dormant coins are reactivating. It does not, however, prove that Bitcoin has entered the same phase observed in a previous cycle.
Demand Must Absorb the Returning Older Coins
The next signal will emerge from how price behaves while long-term holder supply continues falling.
A sustained push through current resistance would indicate that buyers are absorbing the coins returning to circulation without allowing the market structure to deteriorate. Conversely, continued distribution during a failed breakout would carry a less constructive implication, as more active supply would be entering a market still unable to clear resistance.
This is why the on-chain shift should be evaluated alongside price action rather than treated as a standalone rally signal.
Bitcoin has reclaimed its 50-day SMA and reached the top of the descending channel. It still needs to hold above $64,300 before the movement of older coins can be tied to a stronger recovery rather than another redistribution phase within the existing range.
Disclaimer: This article is for informational purposes only and does not constitute financial or investment advice. Technical levels, moving averages, analyst targets, and long-term holder metrics do not guarantee future price performance.
Methodology: The technical analysis uses the BTC/USD daily Bitstamp chart dated August 4, 2026, including its descending channel, Fibonacci levels, horizontal support and resistance, RSI, and 50-day, 100-day, and 200-day SMAs. The broader target references Michaël van de Poppe's public August 4 commentary, while the holder analysis uses CryptoQuant's long- and short-term holder supply data shared by CW8900.

