Bitcoin Eyes $87,000 Rebound as ETF Outflows Top $1 Billion in October
Key Takeaways
- •Bitcoin recovered from a slide toward $81,000 to close Sunday at $83,691, but the rebound did not establish a sustained breakout above resistance.
- •U.S. spot Bitcoin and Ether ETFs recorded combined net October withdrawals of roughly $1.02 billion through Oct. 9, despite a modest $21.1 million Bitcoin fund inflow on Friday.
- •Technical analysis identified $83,500 as a short-term decision level, with upside references near $85,000 and $87,000 and downside supports around $82,000 and $79,500.
- •Glassnode flagged a concentrated selling block between $86,500 and $86,750 on Binance's order book, noted substantial bids near $81,000, and said a settled close above $85,500 would improve the breakout structure.
- •Spot participation remained unusually thin at a seven-day average of roughly $6.8 billion in daily combined exchange and ETF volume, with the Oct. 14 U.S. CPI release positioned as the next scheduled macro catalyst.
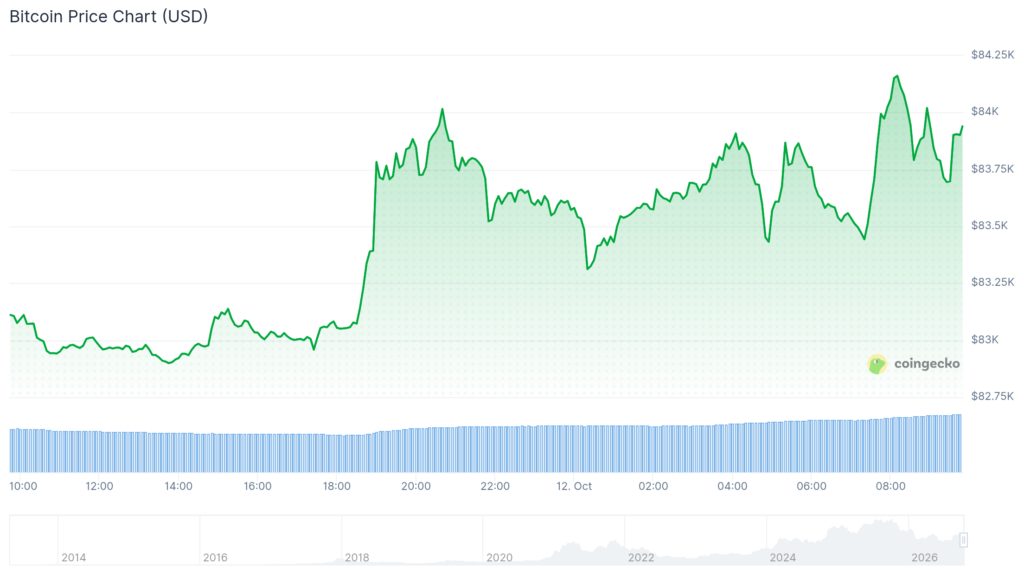
Bitcoin entered Monday's session near a contested resistance zone after recovering from last week's decline, with CoinGecko recording Sunday's closing price at $83,691 following a slide toward $81,000. The rebound, which lifted the price back toward $83,500, came despite continued withdrawals from U.S. spot cryptocurrency exchange-traded funds.
The recovery placed short-term buyers against a weaker institutional demand picture. Farside Investors' daily records showed combined Bitcoin and Ether fund outflows exceeding $1 billion during October through Friday, a divergence that complicated claims that the market had already established a durable bottom and separated the price recovery from capital flows into regulated investment products.
Bitcoin Recovers After a Volatile Trading Week
CoinGecko's historical figures showed Bitcoin closing Oct. 6 at $85,540 before declining to $81,686 two days later. The cryptocurrency then recovered to $82,564 on Friday and $82,918 on Saturday, with Sunday's higher close extending the sequence, although it did not establish a sustained breakout.
The price history also illustrated how quickly October's earlier advances reversed. Bitcoin had closed Oct. 4 at $86,490 before sellers regained control in the following sessions, leaving traders to assess whether the subsequent rebound represented fresh demand or temporary stabilization.
CoinGecko recorded approximately $42.76 billion in trading volume for Friday and $14.84 billion for Sunday. These figures cover cryptocurrency trading activity, not purchases through U.S. investment funds. Weekend volumes also warrant caution, because traditional exchange-traded products do not trade during those sessions.
Resistance Builds Near $85,500
CryptoSavingExpert wrote on X that buyers were attempting to reclaim $83,500 after the retreat, describing that area as a short-term decision point rather than confirmed support. According to the analyst, a sustained move above it could open a route toward $85,000 and eventually $87,000.
The analyst also outlined the downside scenario if the recovery failed: a rejection could return the market toward $82,000, with $79,500 identified as deeper support. These levels represent an analyst's conditional chart interpretation, not independently verified orders or guaranteed destinations.
Glassnode's Oct. 7 market research offered an additional technical reference. The firm identified a selling block between $86,500 and $86,750 on Binance's spot order book, and its analysts said a settled close above $85,500 would improve the earlier breakout structure. That distinction matters because a brief move above resistance does not establish acceptance traders would still need to examine subsequent closes, trading activity, and the reaction of sellers. Glassnode also identified substantial bids around $81,000 during its observation window, though the order-book evidence covered a specific snapshot and could shift as traders repositioned.
ETF Withdrawals Challenge the Recovery
Spot ETFs of this kind hold the underlying cryptocurrency directly and trade on major U.S. stock exchanges, letting investors gain exposure through standard brokerage accounts without directly custodying the asset. U.S. spot Bitcoin funds began trading in January 2024, with Ether equivalents following in July 2024, and their daily creations and redemptions are tracked by data providers such as Farside Investors.
Farside Investors recorded $484.9 million in net Bitcoin ETF outflows on Wednesday, followed by $244.1 million on Thursday. Friday brought $21.1 million of net inflows, providing a modest offset. Across October's completed trading sessions, however, Bitcoin funds registered approximately $386.3 million in net withdrawals.
Ether funds recorded another $56.1 million in outflows on Friday, according to the same provider, bringing their cumulative October withdrawals to approximately $635 million. Combined, the two categories lost about $1.02 billion through Oct. 9, despite several positive Bitcoin fund sessions.
Fund flows measure net investor creations and redemptions rather than direct spot-exchange trading volume, and they cannot independently establish why Bitcoin moved on a particular day. Persistent redemptions, however, would weaken evidence for a broad institutionally supported rebound, and Friday's modest Bitcoin inflow alone did not reverse the monthly withdrawal pattern.
Glassnode's Oct. 7 assessment described spot participation as unusually thin, with its seven-day average for combined spot exchange and ETF volume standing near $6.8 billion daily. Researchers also noted that recent holders supplied substantial profit-taking during the preceding breakout attempt.
Options positioning showed a different picture. Glassnode found approximately 0.56 outstanding put contracts for every call in its observed options market — a ratio below one, indicating heavier outstanding positioning in call contracts — and identified a concentration of modeled liquidation levels beneath prevailing prices, increasing downside sensitivity. Such models estimate vulnerable positions rather than documenting liquidations that already occurred.
Next Catalysts Depend on Demand
The next test comes from trading activity around the recently contested resistance area and subsequent institutional flows. Glassnode identified the Oct. 14 U.S. consumer price index release as another scheduled macroeconomic catalyst. The CPI is a primary gauge of U.S. inflation and a recurring input into Federal Reserve interest-rate expectations, which is why participants across risk assets, including cryptocurrencies, track its release dates. A durable close above resistance, accompanied by stronger spot buying, would provide clearer confirmation than price recovery alone.

