Bitcoin Price Recovers Above $82,000 as Wallets Holding 10 to 10,000 BTC Hit Record High
Key Takeaways
- •Bitcoin rebounded above $82,000 on Oct. 16 after falling below $80,000, ending a three-day losing streak that followed hotter-than-expected September U.S. inflation of 3.7%.
- •Santiment data showed a record 20,338 wallets holding between 10 and 10,000 BTC, with this cohort rising steadily from mid-July through mid-October despite price volatility.
- •Bitcoin closed above its 50-day EMA near $81,506 and 50-day SMA near $81,298, with analyst Ted identifying $80,500 as the key level for continued buyer control.
- •U.S. spot Bitcoin ETFs recorded approximately $261.4 million in net outflows on the day of the inflation release, with preliminary readings showing smaller withdrawals the next session.
- •Key resistance sits between $83,500 and $84,000, followed by the $85,000-$87,000 range, while a drop below $80,000 would shift focus to the $78,000 area.
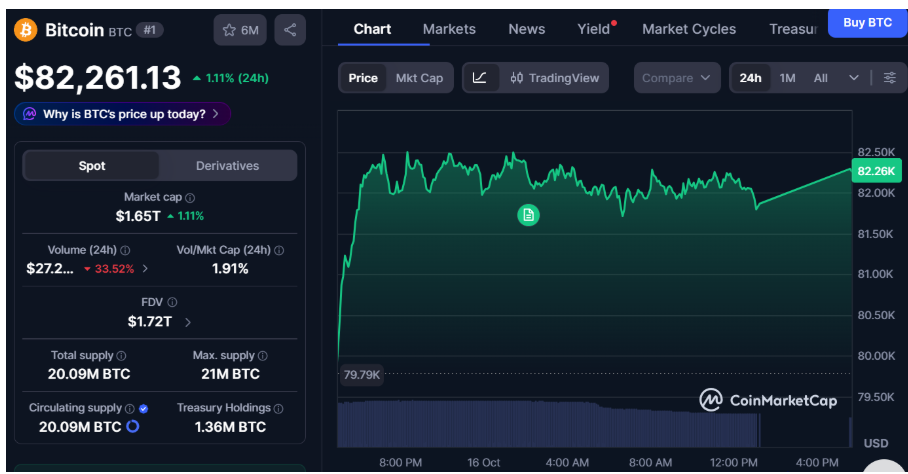
Bitcoin climbed back above $82,000 on Oct. 16 after slipping below $80,000 in the previous session, as on-chain data from Santiment showed the number of wallets holding between 10 and 10,000 BTC reaching a record high of 20,338.
The rebound ended three consecutive days of weakness across the cryptocurrency market, though renewed outflows from U.S. spot Bitcoin ETFs complicated the recovery outlook. Traders are watching whether BTC can hold support around $80,500 and reclaim higher resistance levels.
Bitcoin Regains $82,000 After Inflation-Driven Sell-Off
Bitcoin traded near $82,323 on Oct. 16, reversing part of the decline that had pushed the asset below $80,000 the day before. The selling pressure followed the release of September U.S. consumer inflation data, which exceeded market expectations. Annual inflation came in at 3.7%, renewing questions about the Federal Reserve's interest-rate outlook. Rate expectations matter for crypto because Bitcoin trades as a risk-sensitive asset, so inflation prints that keep policy uncertainty alive tend to move digital-asset markets alongside other speculative holdings.
Bitcoin and several other major cryptocurrencies lost ground as the market digested the report. The recovery broke a three-day losing streak, but BTC remained below the $83,500 to $84,000 range where it traded before the latest downturn, as well as under the recent highs near $87,000 reached earlier in October.
Whale Wallet Count Reaches Record High
Analytics firm Santiment reported that 20,338 wallets held between 10 and 10,000 BTC, the highest count in its tracked data, with the firm recording a steady increase in this cohort from mid-July through mid-October (source: Santiment on X). The rise continued through several periods of price volatility, including the latest market decline.
Santiment tracks these addresses because larger Bitcoin balances have historically moved alongside changes in market conditions. The firm characterized the increase as a sign that large holders continued to maintain exposure while BTC prices moved unevenly. The 10-to-10,000 BTC band is a closely watched segment because it spans holder sizes from substantial retail-scale balances up to near-whale territory, so a steady climb in its count is often read as a gauge of how mid-sized holders are positioned across market swings.
Santiment also noted that a wallet does not necessarily represent a separate investor: exchanges, custodians, and individual holders can control multiple addresses, and a single address may serve multiple customers. The record wallet count therefore describes address distribution rather than the exact number of market participants.
Price Holds Above Key Moving Averages
Crypto analyst Ted noted that Bitcoin closed another daily session above its 50-day exponential moving average and 50-day simple moving average, with the accompanying daily trading data placing the EMA near $81,506 and the SMA around $81,298 (source: Ted on X).
Ted identified $80,500 as the level to monitor for continued buyer control. That threshold sits below both moving averages and near the area Bitcoin crossed during its recent recovery. His chart also placed the upper boundary of a longer-term bull market support band near $75,672, with the lower boundary around $71,156.
ETF Outflows and Key Price Levels
U.S. spot Bitcoin exchange-traded funds recorded approximately $261.4 million in net outflows on the day of the inflation release. Preliminary readings indicated smaller withdrawals during the following session. Spot ETFs hold Bitcoin directly, which is why their daily net-flow figures serve as one of the industry's standard readouts on institutional positioning, and whether the outflows continue to taper will factor into how the recovery is assessed.
The nearest resistance area lies between $83,500 and $84,000, where Bitcoin traded prior to the recent decline. Above that range, previous price activity places $85,000 to $87,000 in focus; Bitcoin approached $87,000 earlier in October before sellers pushed the price lower.
On the downside, $80,500 remains the level flagged for the current recovery. A move below $80,000 would shift attention to the $78,000 area, while a sustained move above $84,000 would mark a further recovery.
This article is for informational purposes only and does not constitute financial or investment advice. Based on original reporting by The Market Periodical.

