Bitcoin Tops $80,000 as $694 Million Liquidation Wave Fuels Recovery Toward $85,000
Key Takeaways
- •Approximately $694.40 million in leveraged cryptocurrency positions were liquidated within 24 hours, with short positions accounting for roughly 70% of the total, or about $556 million.
- •US spot Bitcoin ETFs recorded $74.57 million in net inflows on Wednesday, ending three consecutive days of withdrawals.
- •Bitcoin moved back above its 50-day, 100-day, and 200-day exponential moving averages, with the 50-day EMA at $80,172 serving as the nearest support and $85,000 the next upside resistance.
- •Democrats secured control of both the House of Representatives and the Senate in the US midterms, creating a divided-government environment that could limit President Trump's legislative and fiscal priorities.
- •Daily momentum indicators improved, with the RSI near 49 and the MACD histogram turning positive, signaling a shift in momentum toward buyers.
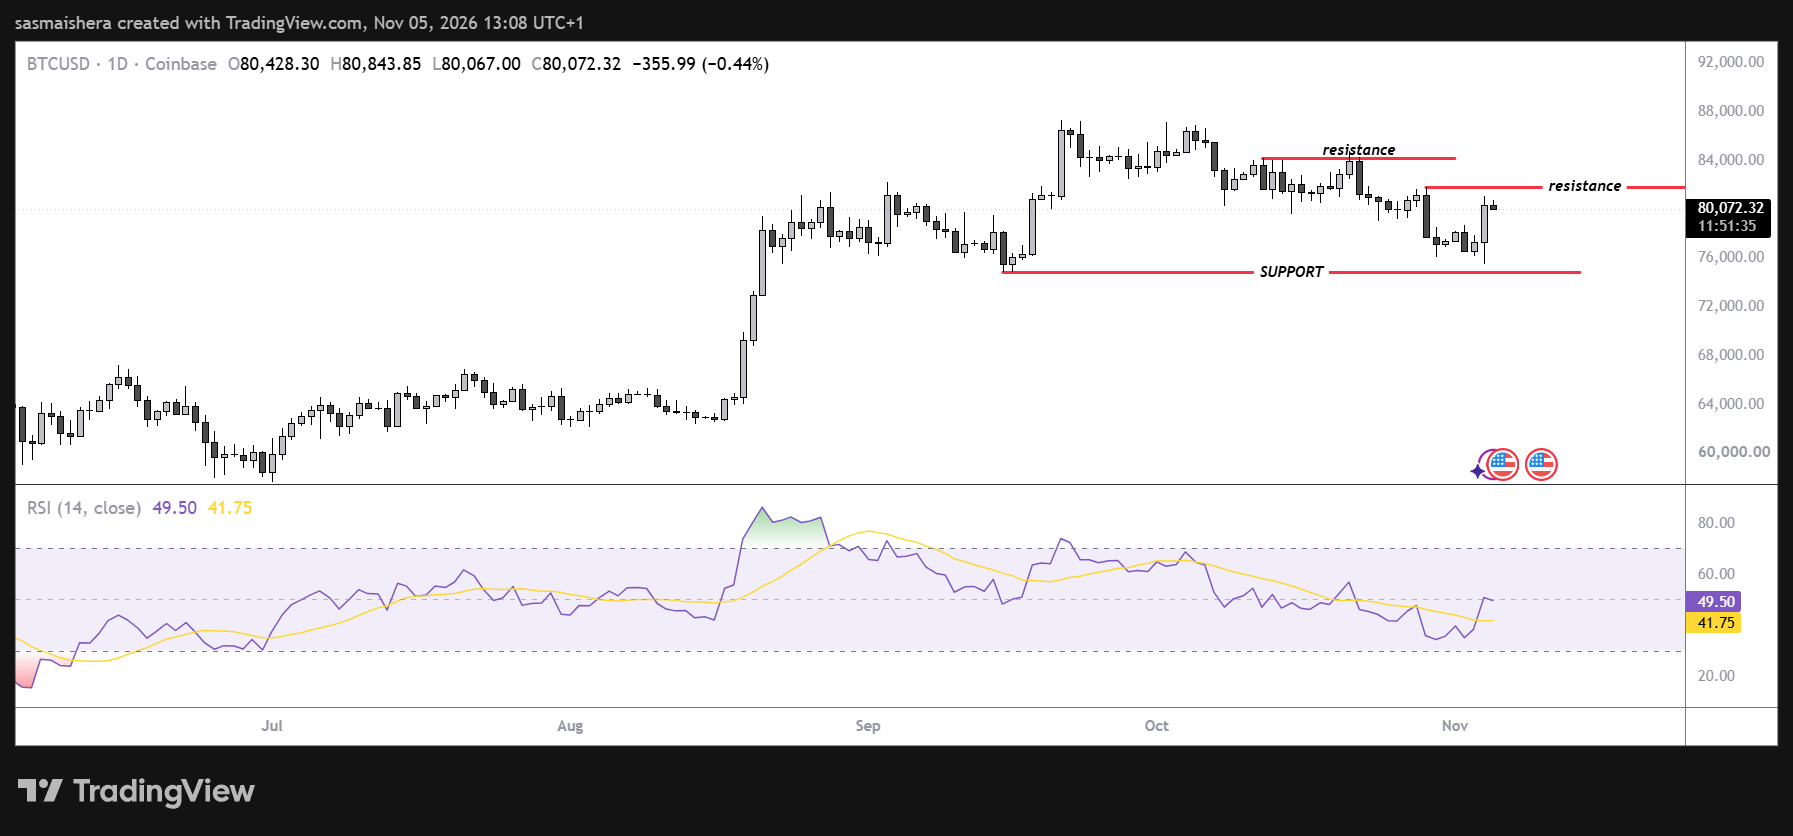
Bitcoin (BTC) climbed above $80,200 on Thursday, extending its recovery after a wave of short liquidations and renewed inflows into US spot Bitcoin exchange-traded funds (ETFs) helped lift market sentiment. The move left the leading cryptocurrency trading above its 50-day, 100-day, and 200-day exponential moving averages (EMAs) for the first time since its recent downturn.
The token traded around $80,200 after closing above its major exponential moving averages during the previous session, with the rebound following heightened volatility across the cryptocurrency derivatives market. According to CoinGlass, approximately $694.40 million in leveraged positions were liquidated over a 24-hour period. Liquidations occur when exchanges automatically close leveraged positions whose margin no longer covers potential losses, a mechanism that can amplify price swings as forced closures hit the market.
Short positions bore the brunt of the losses, accounting for roughly 70% of the total — approximately $556 million. The imbalance indicates that traders betting on further declines were forced to unwind their positions as Bitcoin reclaimed the psychological $80,000 level, meaning bearish traders suffered the largest losses as cryptocurrency prices recovered. Because exiting a short requires buying the asset back, clusters of short liquidations can reinforce an ongoing advance — a dynamic consistent with the role that derivatives unwinding played in Bitcoin's latest leg higher.
Institutional demand also showed early signs of stabilization. US spot Bitcoin ETFs recorded $74.57 million in net inflows on Wednesday, ending three consecutive days of withdrawals. Such funds give investors Bitcoin exposure through ordinary brokerage accounts, and their daily net flows are widely tracked as a gauge of institutional participation.
Meanwhile, the outcome of the US midterm elections contributed to improving sentiment across risk-sensitive assets, supported by declining oil prices and easing bond yields. Bond yields, which anchor borrowing costs across financial markets, are closely watched by participants in riskier asset classes.
Midterm results lift risk appetite
Bitcoin's recovery gathered momentum following the US midterm elections, in which Democrats secured control of both the House of Representatives and the Senate. The outcome introduced a divided-government environment, potentially limiting President Donald Trump's ability to advance certain legislative and fiscal priorities without congressional support.
Investors also assessed the implications for US foreign policy, particularly the ongoing conflict with Iran. Senate Democratic Leader Chuck Schumer said Wednesday that his party would seek to end the Iran war and could use its control over government funding to push for that outcome.
The political developments contributed to expectations that the risk of further military escalation could diminish. However, the election results do not guarantee a change in military policy, and uncertainty surrounding the conflict remains.
Bitcoin's move above $80,200 coincided with these developments, although the recovery was also supported by substantial derivatives market activity, as the sharp unwinding of leveraged positions contributed to the cryptocurrency's latest price advance.
Bitcoin reclaims major moving averages
Bitcoin's daily technical outlook has improved after the cryptocurrency moved back above its 50-day, 100-day, and 200-day EMAs. BTC traded around $80,200 on Thursday, remaining above the 50-day EMA at $80,172. The 100-day EMA stands at $77,904, while the 200-day EMA is located near $76,547.
Exponential moving averages help traders assess market direction by placing greater emphasis on recent price movements. Trading above these indicators suggests that Bitcoin has regained important technical support following the recent downturn.
Bitcoin's immediate challenge is to maintain its position above the 50-day EMA. A sustained hold above $80,172 would strengthen the recovery outlook and suggest that buyers are defending the reclaimed technical level. Failure to hold this area could trigger renewed selling pressure and increase the likelihood of a pullback toward lower support zones.
Momentum indicators on Bitcoin's daily chart also point to improving market conditions. The Relative Strength Index (RSI), a momentum oscillator scaled from 0 to 100 with readings above 50 generally signaling stronger buying pressure, stands near 49, slightly below its neutral midpoint. The Moving Average Convergence Divergence (MACD), which tracks the relationship between two moving averages to flag shifts in trend momentum, has also improved, with its histogram turning positive. A move into positive territory indicates that momentum is shifting in favor of buyers.
Key levels in focus
Bitcoin's immediate technical outlook remains constructive as long as the cryptocurrency maintains support above its major moving averages. The next significant upside resistance is located at $85,000, a horizontal level that could attract profit-taking if the recovery continues. A sustained breakout above $85,000 would strengthen the technical picture, although the supplied technical data does not establish a confirmed higher resistance target.
On the downside, the first important support level stands at the 50-day EMA near $80,172. This area is particularly significant because it sits close to the psychological $80,000 threshold. A daily close below the 50-day EMA could weaken near-term momentum and expose the 100-day EMA at $77,904.
If selling pressure intensifies, the next major support would be the 200-day EMA near $76,547. A sustained break below the 200-day EMA would undermine the current technical structure and raise the risk of a deeper correction.
Beyond the chart, the durability of the recovery can be gauged in coming sessions by whether US spot Bitcoin ETF inflows continue after ending the three-day withdrawal streak, and by how derivatives-market liquidation data evolves alongside the price move. For now, the combination of reclaimed moving averages and improving momentum indicators favors further recovery, provided buyers continue defending the support zone.

