Bitcoin Reclaims $64,000 and Eyes $65,000 as Volatility Compression Deepens
Key Takeaways
- •Bitcoin quickly rebounded after testing and holding the $63,300 area, a level one analyst said is important for a continued move higher.
- •Bitcoin's implied volatility is in the bottom 2% of its historical range, while realized volatility has fallen even faster.
- •Glassnode's volatility value trap score reached 91 out of 100, its highest reading in more than three and a half years.
- •Bitcoin has traded mostly between $62,000 and $65,000 since late July without producing a sustained breakout.
- •CoinGlass data shows liquidation clusters near $64,000 and $64,700 on the upside and around $62,700 and $62,200 on the downside.
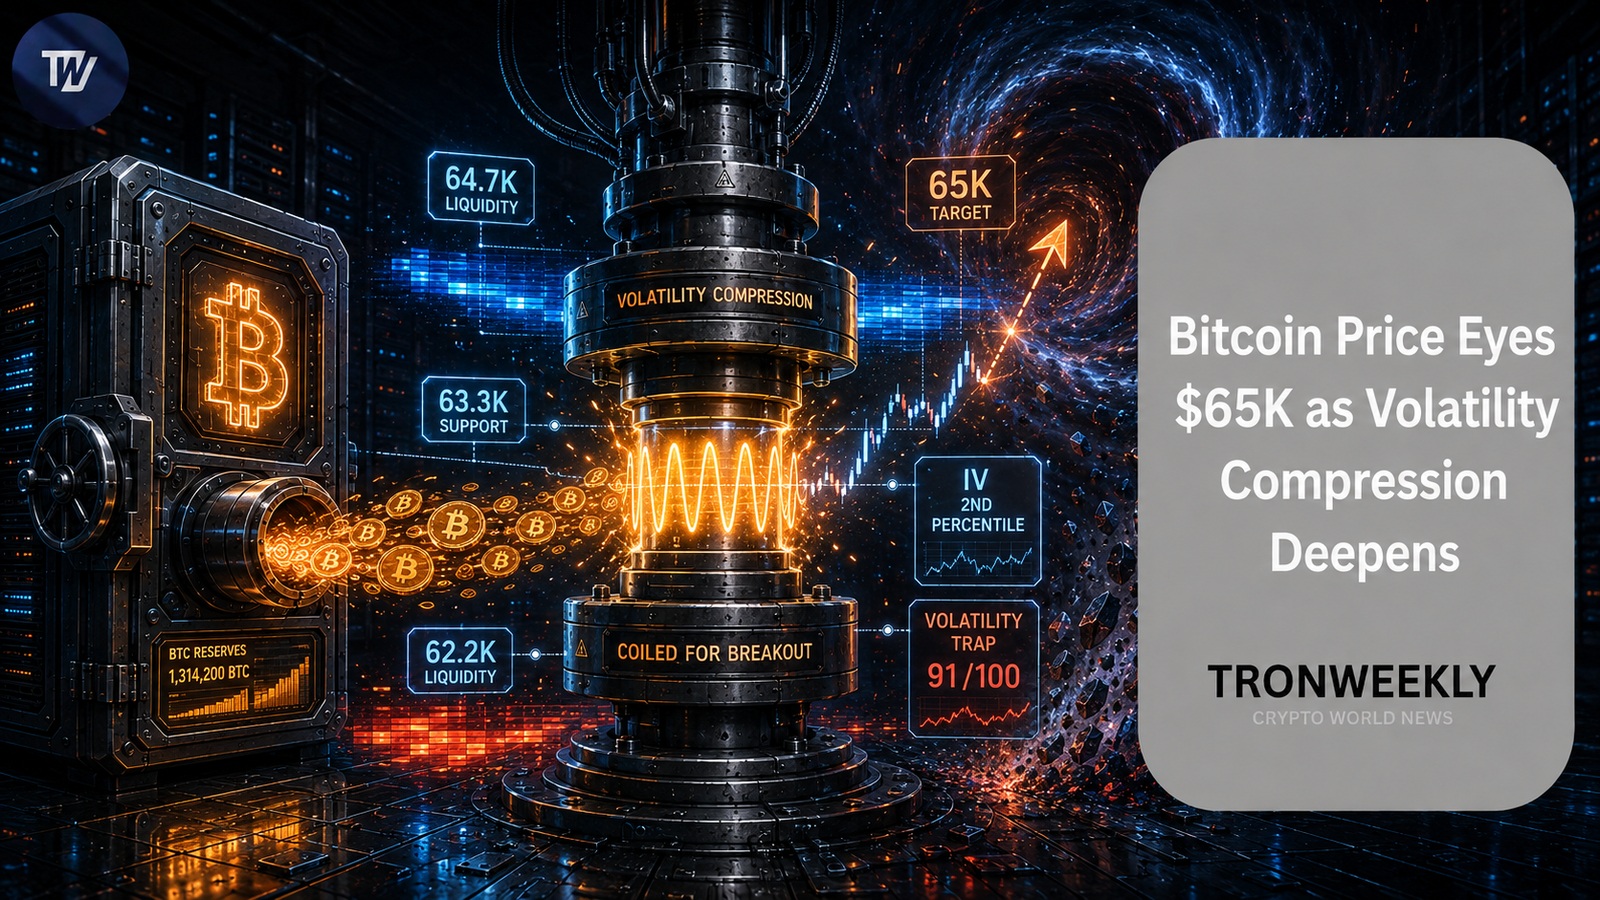
Bitcoin, the largest cryptocurrency by market value, rose nearly 2% on Aug. 17 and climbed back above $64,000 after buyers stepped in to defend the $63,300 area. The rebound improved the cryptocurrency's near-term setup, but weak daily momentum and unusually low volatility continue to leave the direction of the next major move unresolved.
The advance returned Bitcoin to the upper portion of a range that has contained its price action since late July, with market attention now fixed on whether the recovery can extend toward the $65,000 level. Daily momentum remains weak even after the bounce, a factor that has kept the broader picture unsettled.
Analyst Points to Buying Interest at $63,300
Analyst Michaël van de Poppe, a closely followed crypto market commentator, described the reaction around $63,300 as an important precondition for any further advance. In a post on X, he noted that Bitcoin tested the level and was quickly bought.
This is what is required for #Bitcoin to trend higher, as it tested that $63,300 area and quickly got bought up. Great signs. A revisit of that area would be weakness, and I'm personally not expecting to see lower numbers. In this aspect, I honestly expect to see that… pic.twitter.com/wmeN7iUlAx
— Michaël van de Poppe (@CryptoMichNL) August 17, 2026
The rapid absorption of selling pressure at that level was, in his view, exactly the kind of behavior required for Bitcoin to trend higher. Van de Poppe added that another revisit of the area would signal weakness. Instead, he expects the Bitcoin price to continue toward $65,000 if the current recovery holds.
Volatility Falls to Historic Lows
Rafael Schultze-Kraft, co-founder of the blockchain analytics firm Glassnode, highlighted an unusual configuration in the options market. He said that Bitcoin's implied volatility currently sits at the 2nd percentile of its historical distribution. Implied volatility measures how much price movement options traders expect in the future, but it does not indicate whether they expect prices to rise or fall.
Schultze-Kraft emphasized that implied volatility still stands at roughly 1.5 times realized volatility in Bitcoin. Realized volatility is a measure of recent price movements, and it has fallen even faster than the options market's pricing.
Cheap vol ≠ good value. $BTC implied vol is in the bottom 2% of its history, yet options still price ~1.5x what the tape delivers. Our vol value trap score prints 91/100. Hasn't been this high in more than 3.5 years. pic.twitter.com/UF1eoLL1AO
— Rafael (@n3ocortex) August 17, 2026
The disparity, he argued, demonstrates that the premium for future volatility paid by options traders remains considerable despite Bitcoin's extremely narrow recent trading range. A Glassnode score representing this "volatility value trap" reached 91 out of 100, marking its highest level in more than three and a half years.
Schultze-Kraft further noted that low implied volatility is not always an indication of cheap options. Because realized volatility has declined even more sharply, the relative premium attached to options remains elevated.
Past episodes of severe volatility compression have often been followed by sharp price swings. Glassnode's data, however, does not indicate whether the next move will be higher or lower. Capital flows, macroeconomic policy, and new market catalysts could all shape the eventual direction, and current volatility readings favor neither a bullish nor a bearish outcome.
Liquidity Sits on Both Sides of the Market
Since late July, Bitcoin has traded between $62,000 and $65,000. The range has produced a few quick deviations, but none has developed into a sustained breakout.
According to the weekly liquidation heatmap from CoinGlass, an aggregator of derivatives market data such as open interest, funding rates and liquidation levels, large clusters of leveraged positions sit both above and below the current Bitcoin price. Liquidations occur when exchanges forcibly close leveraged trades as price moves against them, and such clusters frequently act as focal points for market activity.
The nearest strong overhead level is located at $64,000, with a larger concentration of positions around $64,700. A move through those areas could trigger a short squeeze, in which traders who bet on falling prices are forced to buy back their positions, increasing demand for Bitcoin and carrying its price toward $65,000. The larger cluster sits just below the top of the range that has contained Bitcoin's price action since late July.
On the downside, liquidity can be found at $62,700 and $62,200. A rejection at current levels could produce a move into those areas and the liquidation of leveraged long positions. These clusters represent potential zones of intensified market activity driven by the forced closure of positions, though they do not confirm a breakout in either direction.
Taken together, the heatmap indicates that the near-term liquidity range could stretch between $62,200 and $64,700, while Glassnode's volatility data shows BTC volatility compressed to historic lows.
Key Short-Term Boundaries
Bitcoin remains caught between strengthening support near $63,300 and historically compressed volatility. Resistance near $64,700 and support around $62,200 define the key short-term boundaries, and a decisive break on either side could shape the next major move.
This article contains market analysis and price predictions. These are not guarantees. Crypto markets are volatile. Always DYOR. Not financial advice.

