Bitcoin Rebounds Above $69,000 After Selloff as Focus Shifts to $72,000–$74,000 Liquidity
Key Takeaways
- •Bitcoin fell to $67,568 on November 13, testing its 200-week moving average near $67,900 for the first time since August, before buyers lifted the price back above $69,000.
- •The selloff removed earlier defenses at $72,000 and pushed the price below its 200-day average near $73,100, and analyst Rekt Capital views reclaiming $72,000 as an initial step rather than confirmation of a lasting recovery.
- •CoinGlass data showed long trades made up roughly 95% of Bitcoin liquidations during the decline, with heatmap estimates placing short-liquidation clusters between $72,000 and $74,000.
- •US spot Bitcoin ETFs recorded $299.8 million in net outflows on November 11 and $284.1 million on November 12, including $203.8 million from BlackRock's IBIT, bringing total losses to nearly $880 million across four sessions beginning November 9.
- •Bitcoin's retreat below $70,000 coincided with rising Treasury yields and weakening US equities, adding pressure across risk assets.
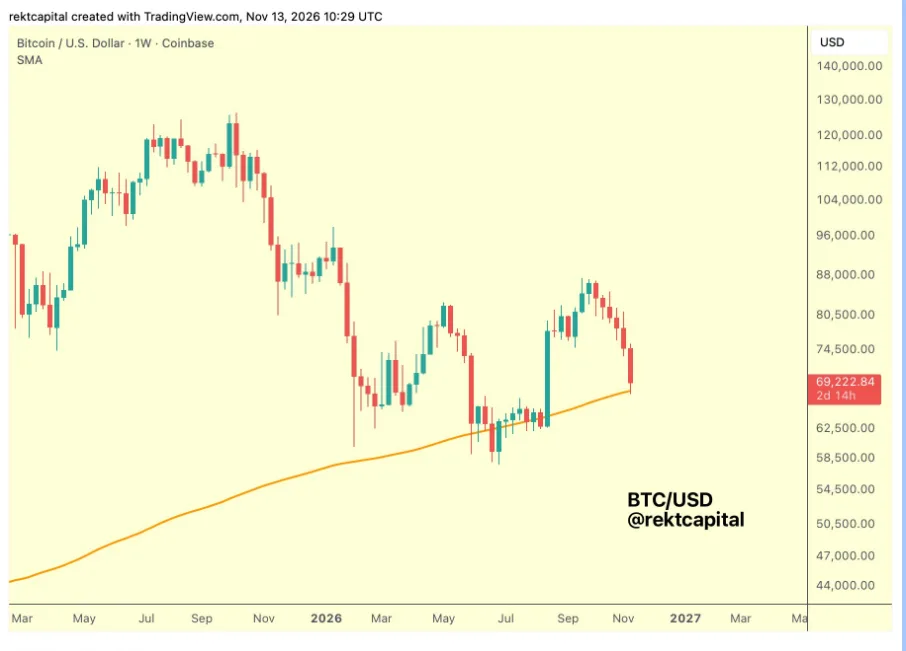
Bitcoin climbed back above $69,000 on November 13 after a sharp selloff dragged the price down to $67,568 and into territory it had not tested since August. The bounce stabilized the market near a widely watched long-term support level, but the recovery remains fragile: selling pushed BTC below several levels it had defended earlier this month, and liquidation maps show clusters of leveraged positions stacked overhead between $72,000 and $74,000.
Bitcoin Stabilizes After Testing Long-Term Support
Bitcoin traded above $74,000 on November 11, but the decline gathered pace once buyers lost control of $72,000. Thursday's slide below that level carried into Friday, when the price briefly dipped under $68,000.
The move took BTC toward its 200-week simple moving average near $67,900, a widely followed indicator that tracks Bitcoin's average weekly closing price over nearly four years. The test carried weight because the price had stayed above the line since August. Bitcoin also slipped below its 200-day average near $73,100 this week, removing another level buyers had defended.
Buyers stepped in around the low and lifted the price back above $69,000, though the rebound did not erase Thursday's losses. BTC spent much of Friday below $70,000, leaving the former support zone overhead. A move back under $67,568 would put the session low at risk again.
Liquidation Data Puts $72,000–$74,000 in Focus
The selloff reshaped positioning among traders using borrowed funds. Liquidations occur when an exchange automatically closes a leveraged position because its margin can no longer cover potential losses, converting the trade into a forced order regardless of the holder's view. Long positions were forced out during the decline, while short positions remained exposed to a sudden rebound. Data from CoinGlass showed long trades accounted for roughly 95% of Bitcoin liquidations during the selloff.
Liquidation heatmaps place notable pockets of estimated short liquidations between $72,000 and $74,000. If BTC climbs into that range, forced short covering could add buying orders to the market. These estimates shift as traders open and close positions, so the levels are not fixed targets, and Bitcoin would need to get back above $70,000 before the higher concentrations come into view.
Analyst Rekt Capital has questioned whether rebounds can hold once Bitcoin loses former weekly support. He previously described the $73,000 area as unreliable support and identified higher resistance around $75,000. For buyers, reclaiming $72,000 would therefore be an initial step rather than confirmation of a lasting recovery.
ETF Outflows Add Pressure to the Recovery
The pullback unfolded alongside continued withdrawals from US spot Bitcoin exchange-traded funds. Launched in January 2024, these funds hold Bitcoin directly, and their daily flows are widely monitored as a gauge of institutional participation because inflows and outflows translate into buying or selling of the asset by the funds themselves. Figures compiled by Farside Investors show $299.8 million in net outflows on November 11, followed by $284.1 million on November 12. BlackRock's IBIT accounted for $203.8 million of Thursday's withdrawals. Across four sessions beginning November 9, the funds lost nearly $880 million, according to the same records.
The fund selling coincided with rising Treasury yields and weaker appetite for cryptocurrencies. Bitcoin's retreat below $70,000 also came as US equities weakened, adding pressure across risk assets. The ETF figures point to reduced demand through those products, although they cannot explain every intraday price movement. The next round of daily flow figures will show whether demand through these vehicles is stabilizing or continues to fade.
Key Levels Ahead
Friday's bounce leaves Bitcoin between two important areas on the chart. The $67,500 to $68,000 region sits near the day's low and the 200-week average. Above the market, the $72,000 to $74,000 zone remains the area traders are watching for signs of a stronger recovery.
This article provides information, not investment advice. Cryptocurrency investments carry financial risks.
Based on reporting by The Market Periodical, November 13, 2026.

