Bitcoin Tests Recovery Levels as Dormant Coins Wake Up on Coinbase
Key Takeaways
- •Bitcoin rebounded to test the 50-day SMA near $63,300 on August 2, 2026, but failed to hold above it and retreated to approximately $63,050 while remaining inside a descending channel active since July 21.
- •Exchange inflows from coins dormant for two to seven years surged sharply, with the five-to-seven-year cohort rising approximately 1,016% above its quarterly baseline.
- •Coinbase recorded net flows roughly 1,423% above its 90-day average while the Coinbase Premium stayed negative between -0.09 and -0.14, indicating diminished demand from US spot buyers.
- •Binance funding rates held between 0.00 and 0.01, signaling that traders had not built heavily leveraged positions in either direction.
- •CryptoQuant's miner shutdown indicator rose 350% above its quarterly average, suggesting some marginal mining capacity is operating below breakeven following the April 2024 halving.
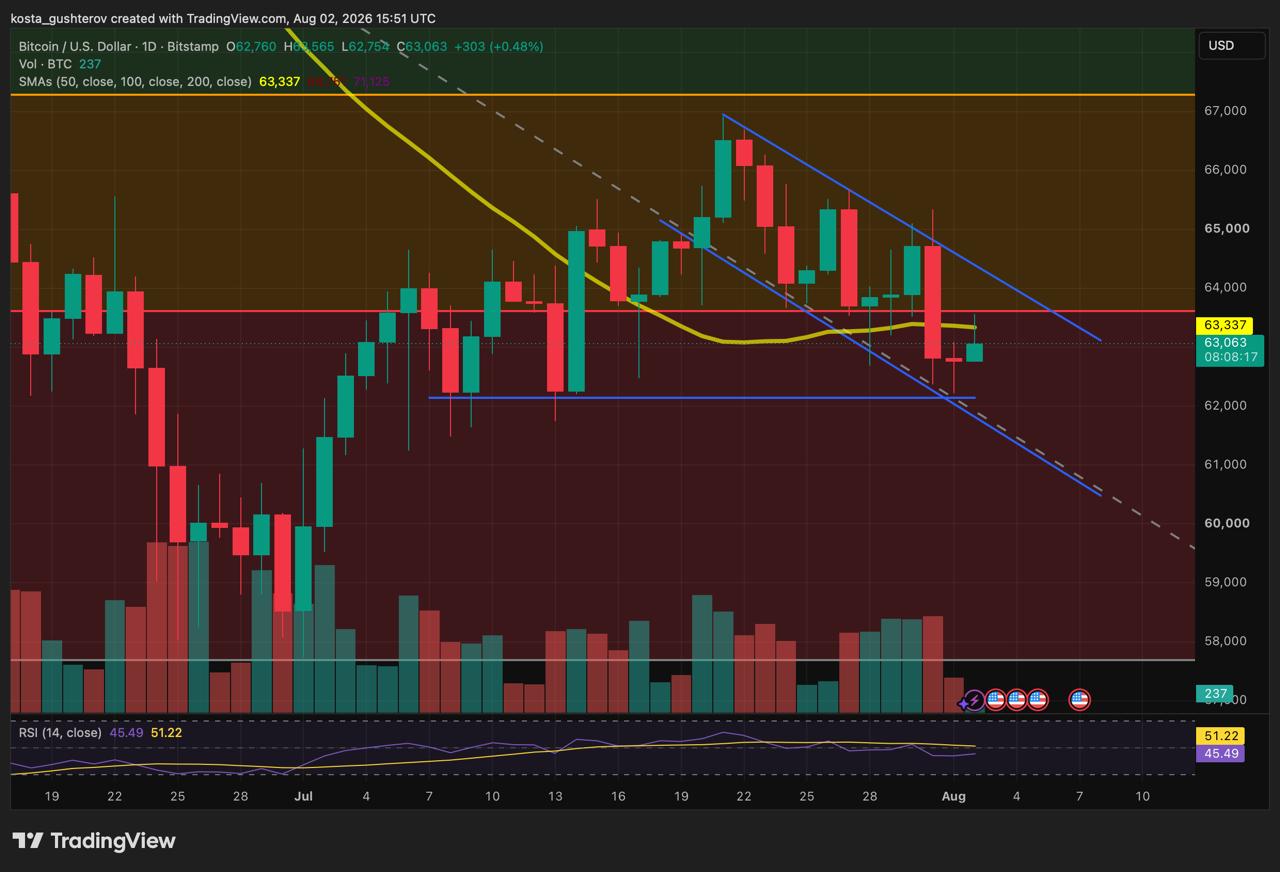
Bitcoin defended horizontal support near $62,100 on August 1, 2026, before staging a rebound on August 2 that tested the 50-day simple moving average (SMA) near $63,300 before fading. The price subsequently returned to approximately $63,050 at the time of writing, leaving the daily candle below that average.
Meanwhile, long-dormant coin inflows to exchanges increased sharply—particularly on Coinbase—while funding rates stayed neutral and CryptoQuant's miner shutdown indicator rose.
Support Holds at a Confluence Zone
Bitcoin's August 1 decline halted near a support level previously identified in Coindoo's earlier analysis. The horizontal level around $62,100 had already arrested pullbacks on July 9 and July 14. It also sat close to the lower boundary of the descending channel, creating a narrow confluence zone rather than a single exact line.
The August 2 session opened near $62,700, and Bitcoin pushed upward to probe the 50-day SMA around $63,300. However, the 0.236 Fibonacci retracement near $63,600 was not reached and remains intact as resistance. This leaves Bitcoin inside the descending channel that has guided the price lower since July 21.
Older Coins Return to Coinbase as US Demand Stays Weak
The weak follow-through coincided with a sharp increase in exchange inflows from coins that had remained inactive for between two and seven years, according to a CryptoQuant analysis. The two-to-seven-year dormancy window means these coins were last active between roughly 2019 and 2024, a period that spans the 2020–2021 bull market, the 2022 bear market bottom, and the early-2024 run to new highs. Holders from those cohorts would be sitting on substantial gains at current prices, which is relevant to understanding why some may now be repositioning. The data does not prove that these transfers caused the failed rebound, but it indicates that more dormant supply was becoming available at a time when US spot demand remained subdued.
Inflows from the three-to-five-year cohort rose approximately 595% above their quarterly baseline, while the five-to-seven-year group surged by roughly 1,016%. These percentages were amplified by relatively low starting levels, though the increase appeared consistently across several age cohorts. Spending from the two-to-three-year group represented approximately $315 million in realized value, while the three-to-five-year segment accounted for an additional $216 million.
An exchange deposit does not by itself prove that the holder intends to sell; it does, however, place the coins in a venue where they can be traded more readily.
Coinbase recorded net flows approximately 1,423% above its 90-day baseline, with inflows from three-to-five-year-old coins rising by about 1,014%. During the same period, the Coinbase Premium remained between -0.09 and -0.14, its weakest stretch in two weeks. The negative reading means Bitcoin traded at a lower price on Coinbase than on comparable offshore markets, indicating diminished demand from US spot buyers.
In effect, more dormant supply was reaching Coinbase at a time when buyers on the platform were not willing to pay a premium. That dynamic could make rebounds more difficult to sustain, although it does not establish a causal link between the inflows and Bitcoin's rejection at the moving average. The activity also falls short of signaling a broad exit by long-term holders. Binance, by contrast, recorded steadier inflows rather than the same concentrated spike, suggesting that part of the movement may have been specific to Coinbase.
Funding Shows No Crowded Leveraged Position
Binance funding remained near neutral, ranging between 0.00 and 0.01, indicating that traders had not built a heavily leveraged position in either direction. The current price weakness is therefore unfolding without the liquidation pressure typically associated with a crowded futures market.
The duration of the aged-coin inflows now matters more than the initial percentage jump. A brief rise may be absorbed by the market, whereas continued deposits alongside a negative Coinbase Premium would place more available supply against persistently weak US spot demand.
Miner Stress Is a Slower-Moving Risk
CryptoQuant's miner shutdown indicator moved to 1, rising 50% above its monthly baseline and 350% above its quarterly average. The signal suggests that some marginal mining capacity is operating below breakeven. The April 2024 halving cut the per-block subsidy from 6.25 BTC to 3.125 BTC, which structurally reduced revenue for the mining sector. Difficulty adjustments have since rebalanced the network, but less efficient operations remain more exposed when spot prices decline. Less efficient miners may respond by shutting down machines, reducing expenses, or selling part of their reserves to cover operating costs.
A single reading does not confirm that miners are already selling enough Bitcoin to move the broader market. The indicator becomes more significant if weak profitability persists and miner outflows begin to climb. For now, it identifies another potential source of supply alongside the movement of older coins to exchanges.
The 50-Day SMA Is the First Short-Term Recovery Test
The immediate recovery hurdle is the 50-day SMA near $63,300, which Bitcoin touched on August 2 before slipping back below it. The 0.236 Fibonacci retracement near $63,600 sits just above the moving average. Reclaiming both levels would repair the late-July breakdown, though Bitcoin would still remain inside the descending channel until it clears the upper boundary.
Support holds near $62,100, with the channel floor running slightly lower. The Relative Strength Index (RSI) stands around 45, below the neutral 50 level and its signal line near 51, reflecting the weak momentum behind the rebound.
For now, older-coin inflows and subdued Coinbase demand continue to constrain follow-through. Whether the dormant-coin activity is a transient spike or the start of a longer redistribution will depend on whether aged-cohort deposits continue in the coming sessions while the Coinbase Premium remains negative.
Disclaimer: This article is for informational purposes only and does not constitute financial or investment advice. Technical levels, exchange flows, miner indicators, and historical coin movements do not guarantee future price performance.
Methodology: The analysis uses the BTC/USD daily Bitstamp chart dated August 2, 2026, including the 50-day SMA, 0.236 Fibonacci retracement, horizontal support, descending channel, and RSI. On-chain context comes from CryptoQuant data covering aged-coin exchange inflows, realized spending, Coinbase net flows, the Coinbase Premium, Binance funding, and the miner shutdown indicator.

