Bitcoin Price Returns to the $76,000 Support Shelf Built in September
Key Takeaways
- •Bitcoin declined 1.48% to $76,840 after losing both the 50-day simple moving average at $81,942 and the 0.236 Fibonacci level at $80,403 earlier in the week.
- •The intraday low near $76,500 landed just above a three-layer support confluence packed into about $125: the 0.382 Fibonacci retracement, the 100-day moving average, and the mid-September floor of $76,066.
- •The 14-day RSI fell to 33.07, a level last reached during the June-July capitulation base near $57,700, suggesting much of the selling pressure may already be spent even though sellers hold short-term momentum.
- •A daily close beneath $76,066 could open a move roughly 5% lower toward the 200-day moving average at $73,159 and the 0.500 Fibonacci midpoint at $72,561, with deeper supports at $69,056 and $64,065.
- •The selloff unfolded as the Binance hack came to light, with 18.03K BTC traded in the session so far.
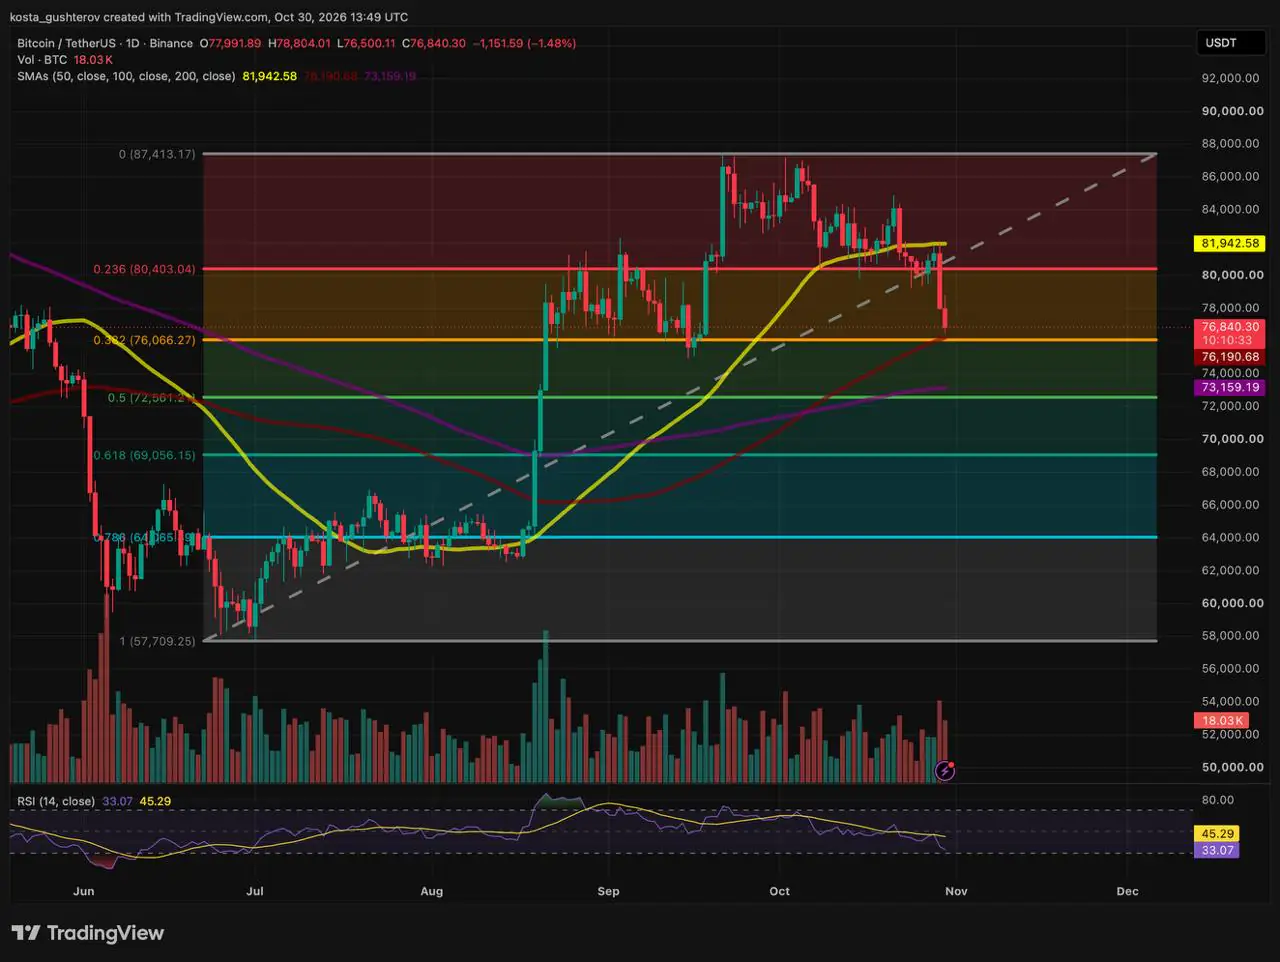
Bitcoin traded at $76,840, down 1.48%, or $1,150, on the day, according to the Binance BTC/USDT daily chart. A brief push higher was turned back, and price fell to an intraday low near $76,500, about $300 above the 100-day simple moving average, on 18.03K BTC of volume so far in the session.
How Bitcoin Got Here
The slide began earlier in the week, when Bitcoin lost both its 50-day simple moving average at $81,942 and the 0.236 Fibonacci level at $80,403.04, ending a stretch in which it had been holding quietly around $80,000. Sellers then pressed a two-day expansion move into the mid-$76,000s as the Binance hack unfolded.
Three Layers of Support at $76K
The session low stopped just above three supports packed into a band of about $125: the 0.382 Fibonacci retracement, the 100-day simple moving average, and the September low. The three arrive by different routes — a fixed retracement ratio, an average of the past 100 daily closes, and a prior swing low — and it is the overlap of such independently derived levels that technicians flag as a confluence zone.
The September low is what makes this more than a calculated level. The $76,066 line held as the exact floor of Bitcoin's mid-September consolidation, and this is the first time price has returned to it in more than five weeks. Below $76,066, the 200-day SMA is the next major level.
The RSI Is Stretched
The 14-day relative strength index, a momentum gauge scored from 0 to 100, sits at 33.07, 12.22 points below its yellow signal line at 45.29. The last time the indicator traded in the 30-to-33 band — the approach to the conventional oversold threshold at 30 — was during the June-July capitulation base near $57,700. Reaching that level while price still holds support suggests much of the selling pressure has already been spent, though short-term momentum remains with sellers.
The Fibonacci grid used for these levels — standard ratios projected from a swing low and high — runs from the $57,700 July base (the 1.0 level) to the $87,400 cycle peak (the 0 level).
What the Chart Adds Up To
The analysis frames the drop from the 50-day SMA to the day's low as the mean-reversion leg that followed the loss of that average. Bitcoin now sits on the densest support cluster above the 200-day, with the RSI near the levels of the summer low. Sellers still hold the momentum; the case for buyers rests on the combination of stacked support and a stretched RSI.
Two Ways the $76K Test Could End
These are conditions to watch on the daily close, not calls on which one comes.
Holds. Buyers defend the cluster on a daily closing basis, helped by the stretched 33.07 RSI reading. Holding above $76,000 would set up a relief bounce toward the day's $78,804 high, then a retest from below of the broken $80,000–$80,403 ceiling. Bitcoin would need to reclaim $80,403 before the 50-day SMA comes back into play.
Breaks. Selling, with 18.03K BTC traded so far this session, overwhelms bids at $76,066 and Bitcoin closes the day beneath both the 0.382 Fib and the 100-day SMA. Losing the mid-September floor would undo the shallow-correction case and could open a move to the 200-day SMA at $73,159 and the 0.500 Fibonacci midpoint at $72,561.21, roughly another 5% lower, where the next layer of support sits.
How Deep the Floor Runs
Below the 200-day band, the 0.618 Fib at $69,056.15 and the 0.786 Fib at $64,065.19 are the deeper supports, with the $57,700 July base underneath it all. A move to the 200-day would still leave most of the summer advance in place; a close below the golden pocket would mean more than 61.8% of it had been given back.
This article is provided for informational purposes only and does not constitute financial or investment advice. Technical levels and scenarios do not guarantee future price movement.

