Bitcoin Price Stuck in $83K–$87K Range as Jobs Data Fails to Spark Lasting Rally
Key Takeaways
- •Bitcoin slipped 1.6% to trade near $84,668 on October 3 after failing to hold gains near $87,220 and touching a session low of $83,888.
- •The price has remained confined to a narrow band between roughly $83,000 and $87,000 for nearly three weeks, with a major trendline support under watch and $83,000 seen as the next key level if it breaks.
- •Analyst Crypto with Haris argues that repeated failures to break the $86,000–$87,000 resistance zone contradict the idea of an ongoing bull run and could lead to a decline toward $62,000.
- •Institutional demand stayed a pillar of the bull case, with BlackRock's IBIT buying $195.6 million in a single day and Fidelity ETF clients separately contributing $29.28 million.
- •The September jobs report showed nonfarm payrolls rose only 29,000 against a 90,000 consensus with unemployment at 4.2%, triggering a brief Bitcoin surge to about $87,100 that quickly faded back to $84,500.
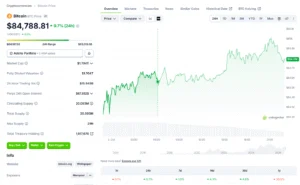
Bitcoin traded near $84,668 on October 3, down 1.6% on the day, after failing to hold gains close to $87,220. According to chart data, the session low reached $83,888. The pullback extended a stretch of range-bound trading that has now persisted for nearly three weeks.
Source: CoinGecko
Traders are watching a major trendline support, with $83,000 seen as the next key level if it gives way. Bears anticipate further downside, while bulls point to steady institutional buying as the foundation of their upside case. Rising liquidations — the forced closure of leveraged positions when traders run low on margin — and sideways trading continue to define the market, leaving the asset stuck inside a tight range between $83,000 and $87,000.
Bitcoin Price Stays Capped Below $87,000
Bitcoin's price action has remained confined to a narrow band between $83,000 and $87,000, hovering near $84,788 at the time of writing. Earlier in the session, buyers pushed the asset up to $87,220, but the rally ran out of steam under renewed selling pressure. Sellers then dragged the price down to a low of $83,888 — just above the $83,000 level. The rapid reversal has left the market choppy, with neither side able to establish clear control inside the band. Ranges like this one matter to traders because they provide clear reference points: a sustained break above the ceiling or below the floor is generally read as the first sign of the next directional phase.
Analyst Crypto with Haris takes a bearish view, pointing to stubborn resistance between $86,000 and $87,000. In his assessment, a rejection from that zone could send BTC down toward $62,000 — a target roughly $22,700 below the current Bitcoin price. He argued that the multi-week sideways action itself contradicts the notion of an ongoing bull run.
"I told you not to trust these $BTC fake pumps. $86K–$87K is very strong resistance, and BTC failed to break it multiple times. This is not how a real bull run looks. If it were real, BTC would not stay stuck between $83K–$87K for almost 3 weeks. In a strong bull cycle, small… pic.twitter.com/W1LKgxKCCE" — Crypto with Haris ₿ (@Crypto__Haris) October 3, 2026
Meanwhile, charts show a major trendline acting as support. If that line breaks, $83,000 becomes the next key level, and traders are watching it closely. Opinions on the next directional move therefore remain split. Rising liquidations have accompanied the sideways chop, yet bulls have not abandoned their case for a move higher. Until one side forces a resolution, watch lists are likely to stay anchored to the trendline, the $83,000 floor, and the range top near $87,000. Overall, Bitcoin remains locked in a holding pattern between key support and resistance.
Institutional Inflows and Jobs Data Shape Sentiment
Institutional flows remain a central pillar of the bull case. BlackRock's IBIT accounted for $195.6 million of buying in a single day, while Fidelity ETF clients separately contributed $29.28 million. Such figures have become a focal point for traders tracking demand for Bitcoin ETFs, which hold the asset directly and can be bought and sold through conventional brokerage accounts — making their daily flow prints one of the most closely followed gauges of institutional appetite. Together, these purchases have fueled hope for a breakout higher, even though the inflows arrived amid sideways trading and rising liquidations.
Macro data also shaped a volatile week for Bitcoin, as U.S. inflation, growth, and labor figures reshaped expectations for Federal Reserve policy. Early in the, BTC fell to around $82,600 before rebounding sharply. U.S. PCE inflation came in below expectations, while JOLTS data pointed to weakening labor demand. The releases collectively recalibrated expectations for the policy path ahead.
The September jobs report drew the biggest reaction of the week, following the PCE and JOLTS readings released earlier. Nonfarm payrolls rose by only 29,000, well below the 90,000 consensus. Unemployment climbed to 4.2%, and wage growth slowed — developments that eased pressure on the Federal Reserve to raise rates again. Labor readings carry outsized weight for crypto traders in this environment because they sit at the front of that transmission chain: hiring data shapes Fed expectations, which in turn move yields and the dollar.
Following the report, BTC surged to around $87,100, but the rally faded quickly and the price slid back to $84,500. Weaker rate-hike expectations alone may not be enough to sustain a rally. Treasury yields, the U.S. dollar, oil prices, and inflation risks remain key factors that continue to influence the Bitcoin price. The next move may follow a chain: inflation, the Fed, Treasury yields, the dollar, and Bitcoin — with each link shaping the asset's near-term direction. In the near term, the market's watch points are the $83,000 support and trendline, the durability of ETF inflows, and each new round of U.S. economic releases.
This article first appeared on Blockonomi.

