Bitcoin holds near $83,000 as easing bearish momentum puts $89,337 in focus
Key Takeaways
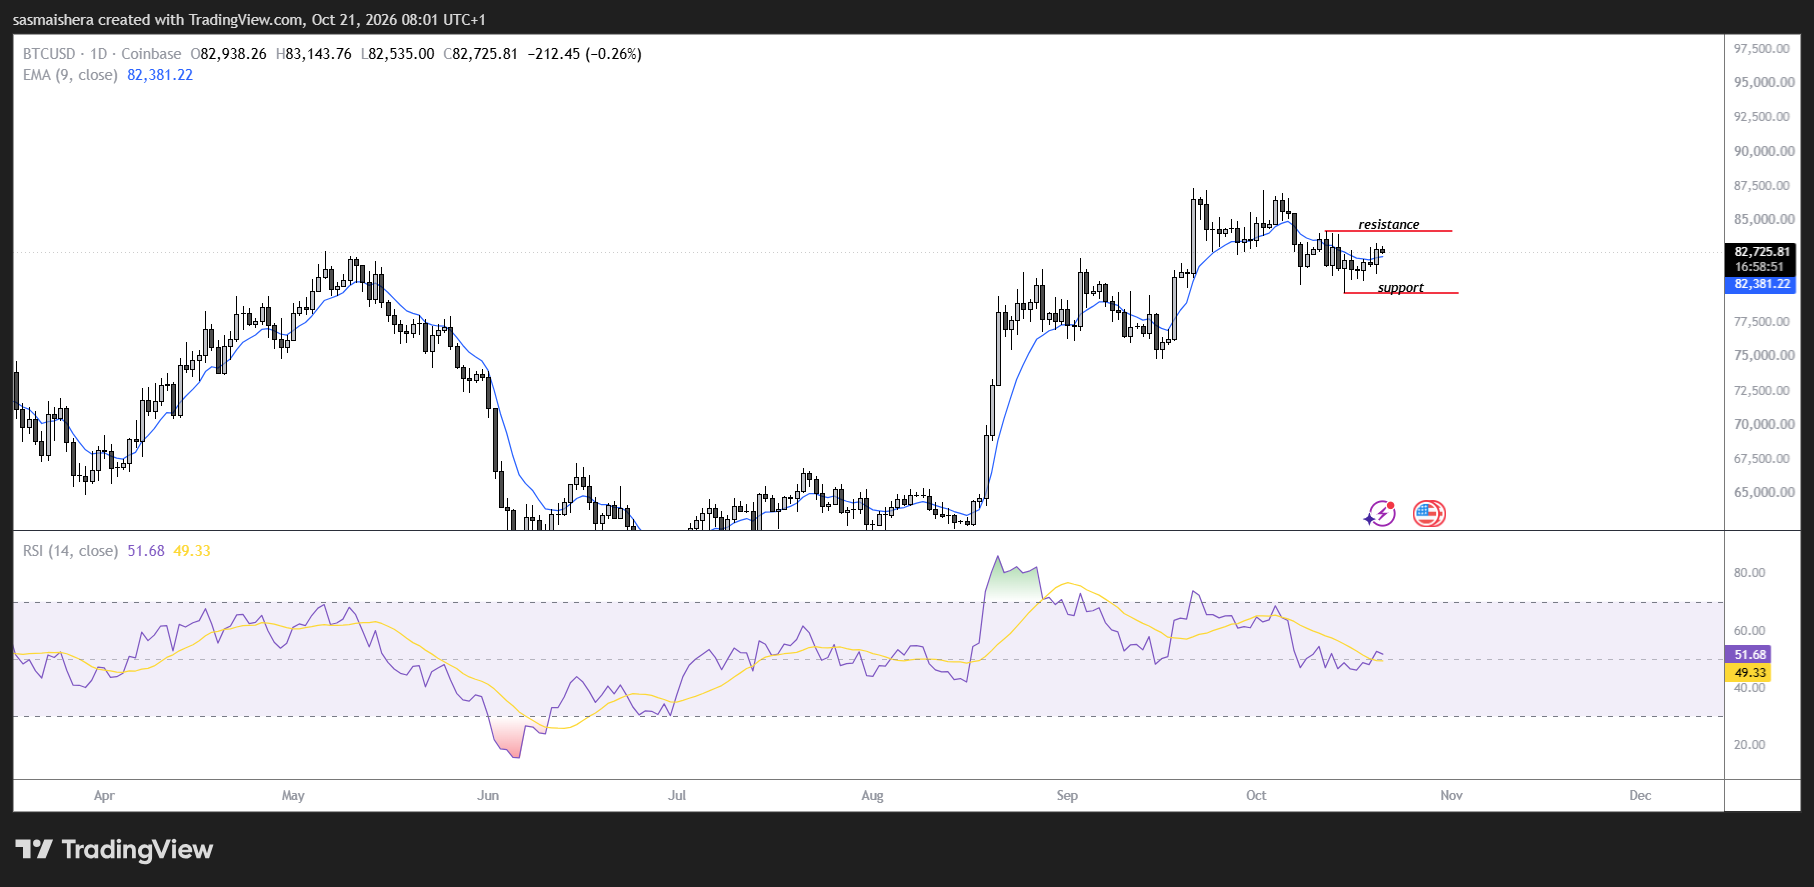
- •Bitcoin held near $82,800 on Wednesday, retaining the prior session's gains as selling pressure showed signs of easing.
- •The cryptocurrency continues to trade above its 50-day EMA at $80,769 and its 200-day EMA at $76,090, preserving a constructive technical backdrop.
- •Bitcoin's daily MACD is approaching a bullish crossover above its signal line, but the signal remains unconfirmed.
- •The Relative Strength Index stands near 51, slightly above the neutral midpoint, suggesting a modest momentum improvement without overbought conditions.
- •The 78.6% Fibonacci retracement near $89,337 is the key upside resistance, and a sustained move through it would bring the $97,924 area into focus as the next target.
Bitcoin stabilizes after bullish daily close
Bitcoin traded near $82,800 on Wednesday, holding on to gains from the previous session as selling pressure showed signs of easing and supported hopes of further upside. Ethereum and XRP also held steady after posting bullish daily closes, according to the report, although the technical picture outlined centers on Bitcoin.
The largest cryptocurrency continues to trade above both its 50-day Exponential Moving Average at $80,769 and its 200-day EMA at $76,090. Moving averages of this kind are among the most widely watched trend gauges in crypto chart analysis, since they smooth out day-to-day noise and are commonly used to distinguish bullish and bearish phases. Holding above both preserves a constructive technical backdrop, though buyers still need stronger momentum to sustain an extended rally.
Momentum indicators point to stabilization
Bitcoin's daily Moving Average Convergence Divergence indicator is approaching a crossover above its signal line. MACD crossovers are tracked closely by traders because they can flag shifts in momentum early, which is why an unconfirmed signal tends to keep markets waiting until it completes. A completed bullish crossover would strengthen the case that downward momentum is fading, but the signal remains unconfirmed for now.
Meanwhile, the Relative Strength Index stands near 51, slightly above its neutral midpoint. Readings above 50 are generally read as momentum tilting toward buyers, so the current level suggests a modest improvement in momentum without indicating particularly strong buying pressure or overbought conditions.
Taken together, the indicators point to stabilization rather than a decisive breakout. Continued price gains would provide stronger confirmation that buyers are gaining control.
Upside resistance at $89,337
On the BTC/USD daily chart, the 78.6% Fibonacci retracement near $89,337 stands out as an important resistance level should Bitcoin's recovery extend. Fibonacci retracements are a staple of technical analysis, with traders using ratios derived from the Fibonacci sequence to mark zones where pullbacks have historically stalled or reversed, and the 78.6% level is among the deepest of these, which helps explain why it often acts as firm resistance. The retracement is drawn between a lower anchor at $57,800 and an upper reference at $97,924. A sustained move through $89,337 would bring the $97,924 area into focus as the next major target within that framework.
These levels represent conditional objectives, and Bitcoin would still need follow-through buying to advance meaningfully from its current position near $83,000.
Support levels to watch
The first significant support level is the 50-day EMA near $80,769. Holding that average would help preserve the latest recovery structure, while a sustained break beneath it would weaken the near-term bullish outlook and shift attention toward the 50% retracement at $77,862. Below that, the 200-day EMA at $76,090 provides a deeper reference for the broader trend, a level many chart watchers treat as a long-term dividing line between bullish and bearish conditions.
Bitcoin's immediate outlook therefore rests on maintaining support while momentum continues to improve. A confirmed MACD crossover, accompanied by sustained buying, would offer clearer evidence that the recovery can extend toward overhead resistance.

