Bitcoin Price Sinks to $55K as Its 2026 Floor Gives Way
Key Takeaways
- •Bitcoin’s Saturday low was approximately 4.5% below the July support level near $57,700.
- •Crypto-futures liquidations totaled $2.53 billion over 24 hours, including $2.27 billion in long positions.
- •U.S. spot bitcoin ETFs recorded more than $580 million in outflows on Thursday, taking November’s total to about $3.47 billion.
- •Bitcoin’s daily RSI fell to 16.18, its lowest level on a chart extending back to late 2023.
- •Strategy’s 850,849 bitcoin holdings were valued at about $50.2 billion versus roughly $64.2 billion in acquisition costs.
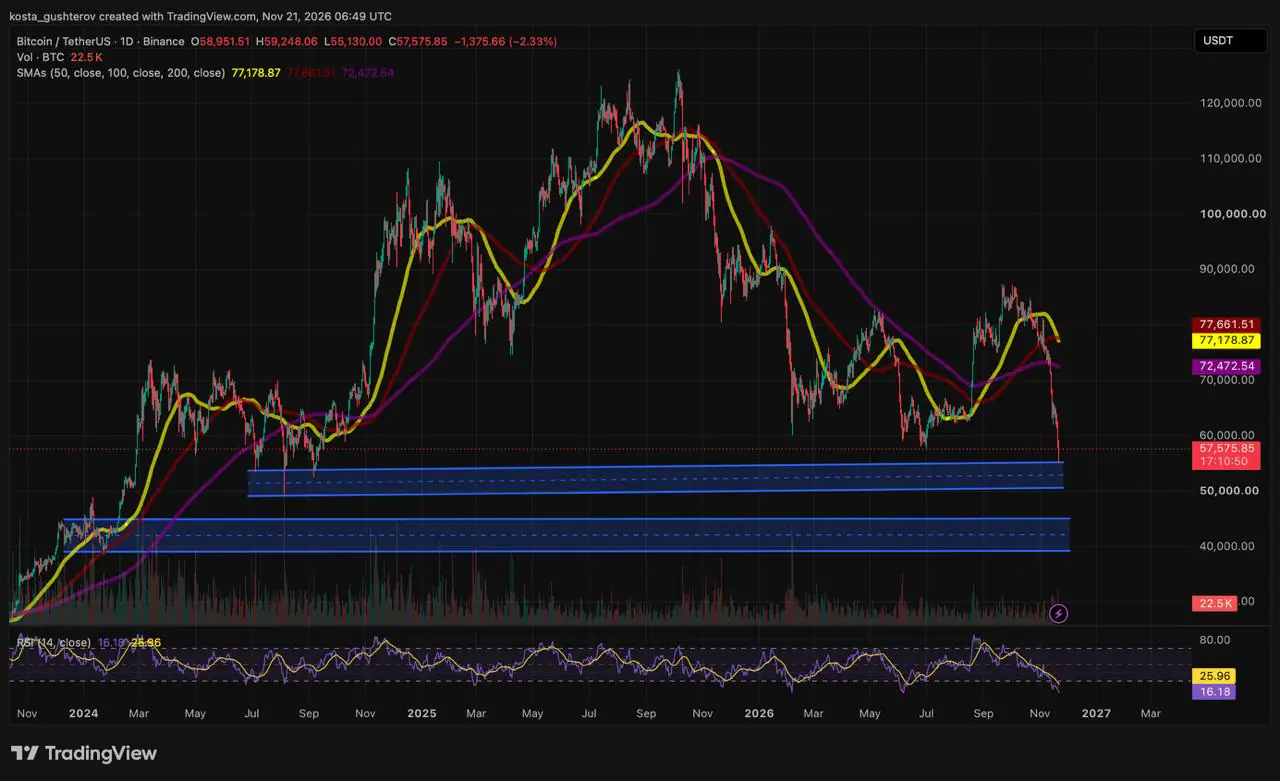
Bitcoin slid to $55,130 on Saturday, breaking below its 2026 low near $57,700 — the July trough many traders had treated as the floor of this year's bear market. The move leaves the largest cryptocurrency down 28% for the quarter, extending a downturn that began after its October 2025 peak above $126,000. From that high, the slide to Saturday's low measures roughly 56%.
The breakdown built over two sessions. On Friday, bitcoin fell through $60,000 for the first time since July as worries over stretched valuations in artificial-intelligence stocks hit risk assets, Reuters reported. The daily candle still closed near $58,952. Saturday's session touched $59,248 before sliding to $55,130, a low roughly 4.5% beneath the July low near $57,700. That level had also been the base of the August–September recovery, which lifted bitcoin back above $70,000 before the rebound stalled below $90,000.
As of 06:49 UTC on November 21, BTC traded near $57,576, down 2.33% — off the low, but still just under the broken floor.
Two Zones Below, One Ceiling Above
The chart marks two zones from earlier in the cycle. The upper zone, roughly $50,500 to $55,400, is built from bitcoin's mid-2024 lows, and Saturday's low stopped almost exactly at its top edge. The lower zone, $39,000 to $45,000, covers the early-2024 range. Between the two lies very little trading history, leaving few prior reference points inside that gap.
The upper zone also holds bitcoin's realized price — the average price at which every coin on the network last moved. Glassnode put it near $53,400 and said on Friday that the market-value-to-realized-value (MVRV) ratio had slipped to just above 1. A reading near 1 means the market's total value barely exceeds the aggregate cost basis of its coins, leaving the average holder close to break-even.
Overhead, resistance has bunched together. The 200-day moving average at $72,473, Glassnode's short-term holder cost basis near $74,100, Strategy's average purchase cost of $75,452 and the 50- and 100-day moving averages near $77,000 all sit between $72,000 and $78,000. The 50-day has just slipped under the 100-day. (Strategy, formerly MicroStrategy, is the largest corporate holder of bitcoin.)
For Strategy, the drop means its 850,849 BTC are worth about $50.2 billion against roughly $64.2 billion paid — the trove underwater versus its cost — and MSTR shares hit a new 52-week low, Yahoo Finance reported.
Oversold, Liquidated and Redeemed
Momentum is deeply depressed. The daily relative strength index (RSI) reads 16.18, below its own average of 25.96 — the lowest reading on a chart that goes back to late 2023. Readings under 30 are conventionally labeled oversold, putting the current figure well beneath even that threshold.
Much of the selling was forced. Liquidations are the automatic closure of leveraged positions once a price move erases the margin backing them. Crypto futures liquidations reached $2.53 billion over 24 hours, $2.27 billion of them in long positions — leveraged buyers, in other words — including more than $1 billion in bitcoin futures and a single $51.71 million long position, according to CoinGlass data.
ETF buyers have turned into sellers. US spot bitcoin ETFs, which only began trading in January 2024, gave conventional brokerage accounts direct access to the token, and their daily flow figures have since served as a widely watched gauge of mainstream demand. BlackRock's iShares Bitcoin Trust recorded $541.1 million in net outflows on Thursday, its largest single-day withdrawal since launch. US spot bitcoin ETFs lost more than $580 million that day, bringing November's outflows to about $3.47 billion, according to CoinDesk's market briefing.
Analysts also pointed to rising inflation-adjusted Treasury yields and a more hawkish Federal Reserve outlook — conditions that raise the opportunity cost of holding non-yielding assets such as bitcoin. The Nasdaq fell more than 4% on Friday to its lowest level since April, and gold dropped to its lowest since September 2025, a sign the pullback stretched well beyond crypto.
What the Big Names Are Saying
"Next stop … goblin town. Hold on to your butts."
"Bitcoin would go down to $10,000."
"…a melt-down that most likely will lead to deflation."
"Seller exhaustion will come long before Saylor exhaustion."
"Bitcoin has weathered so much bad news."
The two camps are arguing over different timeframes. Arthur Hayes and Peter Brandt are describing the next few weeks, against a backdrop of an AI-driven credit squeeze and falling commodity prices. Cathie Wood said ARK's $1.5 million bull case for 2030 still stands and that a return to the all-time high before the end of 2027 would not surprise her. Michael Saylor said only bitcoin going to zero would break Strategy, which he said holds about 3.4 years of cash. He has also said that below a certain mNAV — Strategy's market value measured against its bitcoin holdings — Strategy could sell bitcoin to buy back its STRC preferred stock.
Neither bull named a near-term floor.
Two Cases From Here
For now, bitcoin trades a fraction of a percent below its broken 2026 low and about 8% above the network's average cost. The most immediate reference points sit where the chart already puts them: realized price near $53,400 below, the broken floor near $57,700 just above spot, and the $72,000–$78,000 resistance cluster overhead. Daily ETF flow prints and the level of the MVRV ratio offer the quickest read on whether the selling is persisting or fading.
Disclaimer: This article is for informational purposes only and is not financial, investment or trading advice. Views quoted belong to the people named. Cryptocurrencies are highly volatile; do your own research before making any decision.
Originally published on Coindoo.

