Bitcoin Rebounds Above $80,000 as Traders Watch $77,700 and $82,300
Key Takeaways
- •Bitcoin rose nearly 6% to trade around $80,900 on September 18 after rebounding from the 38.2% Fibonacci retracement near $74,800 and moving through the 23.6% level at $77700.
- •Glassnode's True Market Mean estimate near $76,700 aligns with the $77,700 Fibonacci level, creating a $76,700-$77,700 cost-basis zone whose defense would signal a changed short-term range.
- •CryptoQuant data shows short-term-holder supply fell from about 6 million to 3 million BTC since February, while long-term-holder supply increased from roughly 13 million to 16 million BTC.
- •A daily close above the September high near $82,300 would clear the top of the current range, with Glassnode's estimated US spot ETF cost basis near $85,600 as the next reference above the price.
- •A daily close below $74,800 would weaken the rebound and shift focus to the $72,500 area, where the 50% retracement and the rising 50-day moving average nearly coincide.
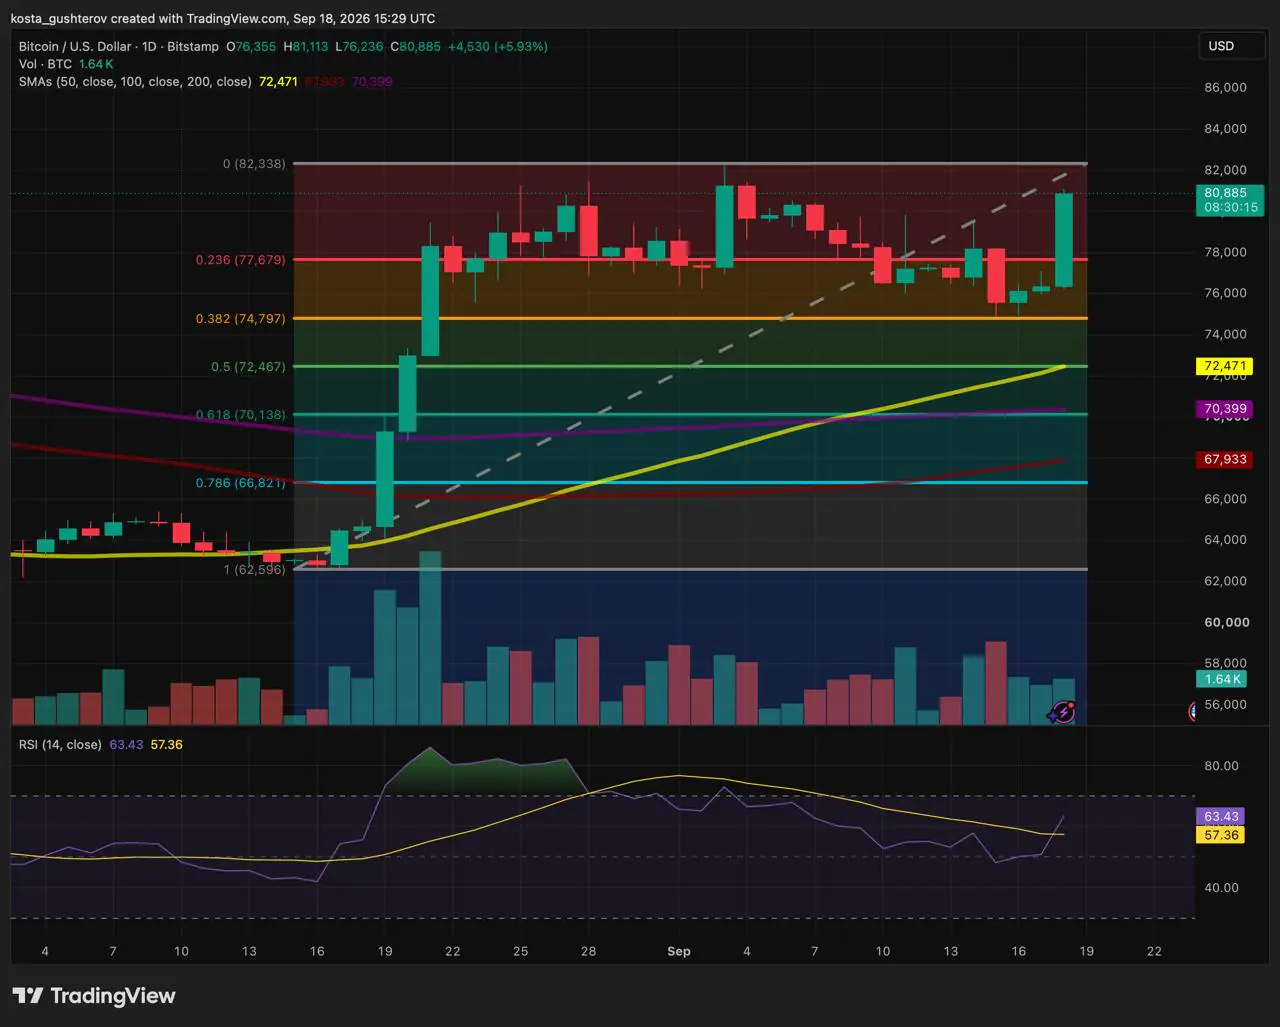
On the Bitstamp BTC/USD daily chart, Bitcoin traded near $80,900 at 15:30 UTC on September 18 after reaching approximately $81,100. The session was up almost 6%, although the daily candle had not yet closed. That distinction matters for the levels discussed below, because several of them are confirmed by a daily close rather than a momentary intraday move.
A larger share of Bitcoin’s supply is remaining inactive as the price moves above the estimated cost basis of economically active investors — the average price at which those investors are estimated to have acquired their coins. The next test for buyers is whether BTC can remain above that area after the initial advance.
Bitcoin rebounds near the 38.2% retracement
Retracement levels are fixed percentages of a measured price swing, which is why traders use them as pre-defined reference points rather than guaranteed turning points. The current Fibonacci range runs from Bitcoin’s August low near $62,600 to its September high around $82,300. On that basis, the 38.2% retracement is near $74,800, while the 23.6% level is around $77,700.
Bitcoin approached $74,800 on September 15 but recovered before the daily close. The price remained above that level during the following sessions, before the September 18 advance carried BTC through $77,700 and toward $81,000.
The move extends the defence of the $76,500-$77,000 area examined in Coindoo’s September 14 Bitcoin analysis. That article measured the broader advance from the June low near $57,700, while the current chart uses the shorter move that began in August. The different starting points explain why the earlier analysis placed its first retracement near $76,500 and the current chart places it near $77,700.
The rebound from $74,800 does not prove that the Fibonacci level caused buyers to enter. It shows only that demand appeared around a retracement level that was already visible before the decline. Daily RSI (Relative Strength Index), a momentum indicator, has also recovered to approximately 63, indicating stronger momentum without reaching the conventional overbought threshold of 70.
Chart and on-chain data converge around $77,000
Glassnode’s latest market snapshot placed Bitcoin’s True Market Mean near $76,700. The metric estimates the average acquisition cost of economically active supply while reducing the influence of older dormant coins. Cost-b estimates of this kind are widely watched because they indicate which groups of holders are in estimated profit or loss at the prevailing price. Glassnode discussed the relevant market data in an X post.
The estimate is close to the chart’s $77,700 Fibonacci level. The two figures come from unrelated calculations, but together they identify a wider $76,700-$77,700 area where recent price action overlaps with the estimated cost basis of active supply.
Bitcoin has moved above that range intraday. A daily close above $77,700 would confirm that BTC finished the session beyond its former ceiling. Establishing support would require another step: the price would need to remain above the level or return to it and attract buyers after the initial surge has passed.
Older coins account for more of the supply
A contributor analysis published through CryptoQuant Quicktake estimates that short-term-holder supply has fallen from approximately 6 million BTC to 3 million BTC since February. Long-term-holder supply reportedly increased from around 13 million BTC to 16 million BTC over the same period. The analysis is available through CryptoQuant Quicktake.
Those figures describe how long coins have remained unspent; they do not identify individual investors. They also do not mean that long-term holders bought three million BTC. Some coins changed categories simply because they remained inactive long enough to pass the platform’s age threshold.
The useful signal is the decline in recent turnover. A larger share of Bitcoin’s supply has stayed inactive through the market’s recovery, potentially leaving fewer coins available from holders who trade frequently. Price moving above the True Market Mean shows that current demand has been sufficient to lift BTC beyond the estimated cost basis of active coins.
That is not enough to establish a supply shock. A credible case would require sustained demand alongside evidence that fewer coins are available for sale. Exchange balances, long-term-holder spending and investment flows would help show whether tradable supply is genuinely contracting.
Three prices will test the recovery
$77,700 must hold during the next pullback
A defence of $77,700 during the next pullback would provide the first evidence that the breakout has changed Bitcoin’s short-term range. Losing the level would return BTC to the wider cost-basis area around $76,700 and leave the latest advance vulnerable to a deeper retracement.
$82,300 remains the breakout level
Bitcoin is already trading around Glassnode’s estimated corporate treasury cost basis near $80,400. This represents an approximate aggregate acquisition price rather than the break-even level of every corporate holder.
The more important chart barrier remains the September high near $82,300. A daily close above it would clear the top of the current range. Glassnode’s estimated US spot ETF cost basis near $85,600 would then provide the next market reference above the price.
A close below $74,800 would weaken the rebound
A daily close below the 38.2% retracement would show that buyers failed to preserve the area where the current recovery started. The next chart reference would be near $72,500, where the 50% retracement and the rising 50-day moving average almost coincide.
Holder patience still needs demand
The next pullback will provide a cleaner test than the size of the September 18 candle. The increase in older supply reduces potential selling only while those coins remain inactive; it does not guarantee that buyers will absorb new profit-taking.
If Bitcoin consolidates above the $76,700-$77,700 cost-basis area, reduced turnover may help support a break of the September range. A quick return below it would show the limit of the holder data: dormant supply can reduce the number of available sellers, but it cannot create the demand needed to sustain higher prices.
This article is provided for informational purposes only and does not constitute financial or investment advice. Cryptocurrency prices, technical indicators and on-chain metrics can change rapidly.
Source: Coindoo

