Bitcoin Price Prediction 2027: Can BTC Reach $150,000 Next Year?
Key Takeaways
- •Bitcoin trades near $81,641, about 84% below the $150,000 level discussed for 2027 and well under its all-time high of roughly $125,761.
- •US spot Bitcoin ETFs have returned to net selling, with roughly $760 million in outflows since October 7 and an additional $82.4 million in net outflows on October 16.
- •Analyst Willy Woo argues bears awaiting a lower bottom are positioned incorrectly, citing capital flows into and out of Bitcoin that he says bottomed on August 9, 2026.
- •Glassnode identifies heavy supply near $88,000 and support between $80,000 and $81,500, noting that a loss of $80,000 would put the True Market Mean near $78,000 in focus.
- •Forecasts diverge widely: CoinShares outlines a soft-landing case above $150,000, ARK Invest projects $300,000 to $1.5 million by 2030, and CoinCentral's 2027 scenarios span $70,000 to $150,000 or more.
Bitcoin Price Prediction 2027: Can BTC Reach $150,000 Next Year?
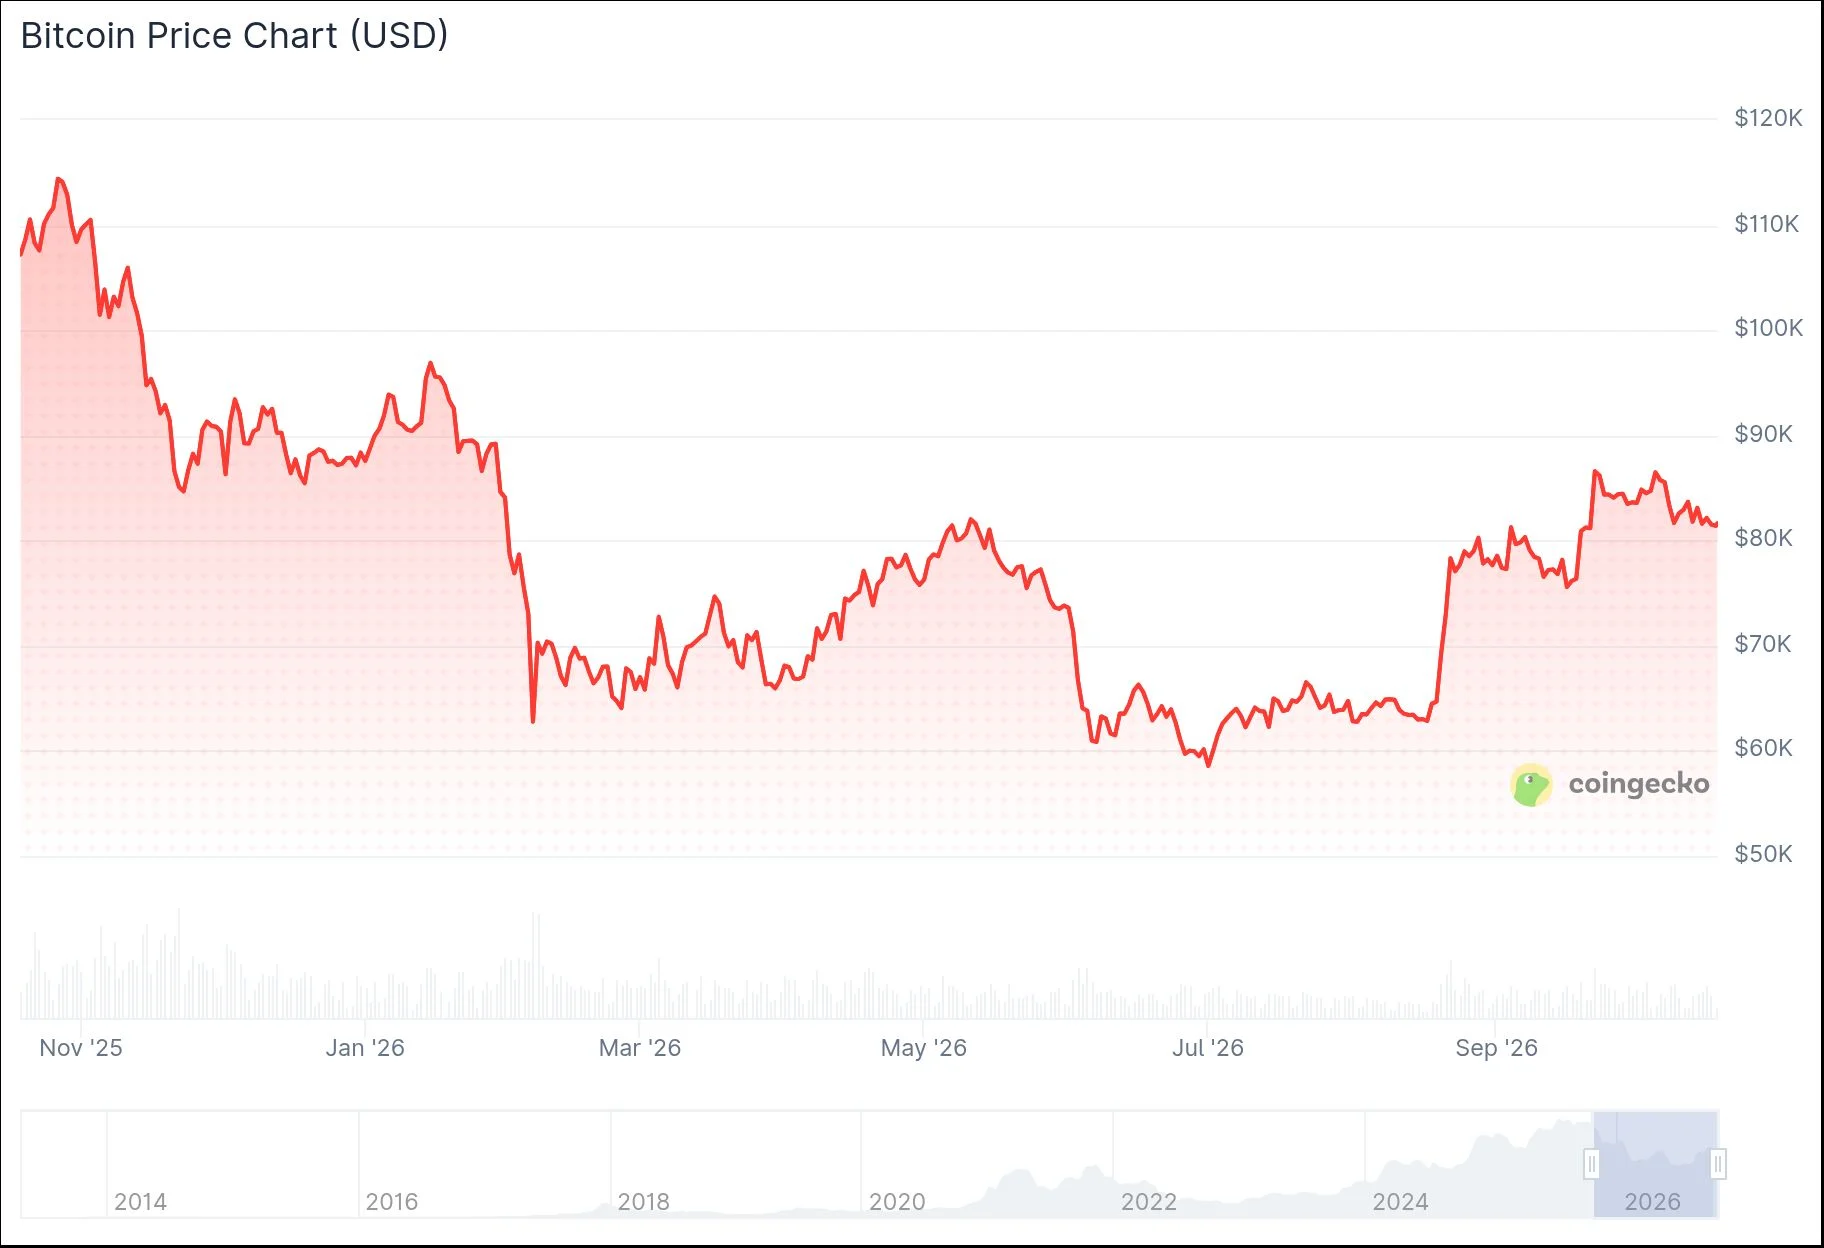
Bitcoin is changing hands near $81,641, according to CoinGecko data, about 84% below the $150,000 level being discussed for 2027. The price has found some stability in recent weeks but remains well below its all-time high of roughly $125,761, and analysts say the market needs a clear breakout before a move toward $150,000 comes into view.
The wider picture is mixed. US spot Bitcoin ETFs, which hold bitcoin directly and whose flows are widely tracked as a gauge of institutional participation, have turned into net sellers again, with Glassnode noting about $760 million in outflows since October 7. Farside data shows a further $82.4 million in net outflows on October 16.
Not every analyst expects a deeper bottom. Analyst Willy Woo says bears waiting for a lower low are on the wrong side of the trade, to capital flows into and out of BTC, which he says bottomed on August 9, 2026. He shared the view in a post on X on October 18.
I personally think bears waiting for a lower bottom are on the wrong side of the trade. Capital flowing in/out of BTC bottomed August 9th 2026. pic.twitter.com/0Q2FsJ5ZLP — Willy Woo (@willywoo) October 18, 2026
Weekly Chart Analysis
Bitcoin's weekly chart on TradingView shows the price breaking above a descending trendline drawn from the all-time high. After the breakout, BTC retested the broken level before moving back toward the low $80,000s. The weekly timeframe is widely used to assess the asset's broader market structure.
Momentum indicators are consistent with the improving technical picture. Weekly RSI, a momentum gauge measured on a scale from 0 to 100, sits near 56.75, above the neutral 50 line, while the MACD, a trend-following indicator that tracks moving-average convergence, has crossed into a more positive posture, with green histogram bars building.
On-chain analytics firm Glassnode says Bitcoin faces heavy supply near $88,000, where many buyers from the past two years are close to break-even. The nearest support sits between $80,000 and $81,500, an area where order-book demand overlaps with the average purchase price of US spot ETF holdings.
Fidelity's Head of Global Macro has also weighed in. According to Bitcoin Magazine, he said a new four-year cycle bull market could be underway, based on power law patterns. He added that there does not seem to be a narrative at the moment, but that bull markets rarely start with one.
NEW: Fidelity's Head of Global Macro says Bitcoin may be entering a new bull market 👀 "A new 4-year cycle bull market could be underway, based on its power law patterns. There doesn't seem to be a narrative, but then again, bull markets rarely start with one." 🐂 pic.twitter.com/ZNYJKEvHJT — Bitcoin Magazine (@BitcoinMagazine) October 17, 2026
Price Scenarios for 2027
Several firms have published 2027 and longer-term outlooks for the asset, and the ranges differ widely because the frameworks use different horizons and assumptions. CoinShares has outlined a soft-landing scenario in which productivity gains push Bitcoin beyond $150,000. In its more moderate case, BTC trades between $110,000 and $140,000.
ARK Invest looks further out. Its 2030 framework projects Bitcoin at about $300,000 in a bear case, $710,000 in a base case, and $1.5 million in a bull case.
CoinCentral's own 2027 framework splits into three cases: a bearish range of $70,000 to $90,000, a base range of $105,000 to $130,000, and a bullish range of $140,000 to $150,000 or more. Reaching the bottom of that bullish range would require a gain of roughly 70% from current levels, while $150,000 implies an advance of about 84%.
Key Levels to Watch
A clean break above $88,000 would be the first step toward those higher targets, and the chart level to watch next is a decisive weekly close above that mark. On the downside, Glassnode says that if BTC loses $80,000, the next important area is the True Market Mean near $78,000, an on-chain cost-basis model.
This article originally appeared on CoinCentral.

