Bitcoin Price Outlook Highlights $58K Risk Ahead of July 29 Volatility Test
Key Takeaways
- •Bitcoin held near $64,632 during Sunday’s session, with intraday trading between $64,193 and $64,829.
- •Support near $59,595 remains the key level to hold, while resistance at $66,921 and $69,228 continues to limit upside follow-through.
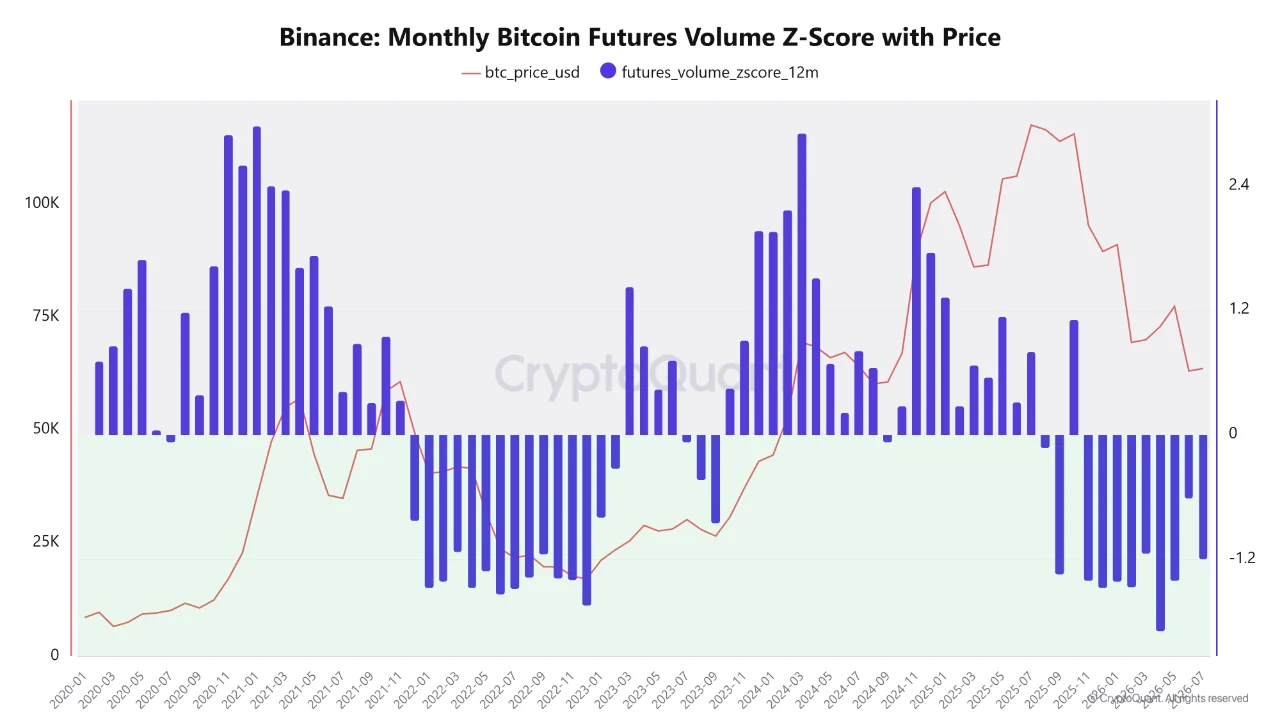
- •Binance futures volume was below its 12-month average, with a Z-score of minus 1.19, indicating weak derivatives participation.
- •A liquidation heatmap cited more than $2 billion in liquidation liquidity near $58,000, which could matter if Bitcoin breaks below support.
- •Galaxy Research data showed dormant Bitcoin activity fell in the second quarter to its lowest level since the third quarter of 2022.
Key Insights
Bitcoin price analysis focused on a potential volatility window around July 29.
Binance futures volume stayed below its 12-month average.
Support near $59,600 remained the key level separating consolidation from possible liquidation pressure.
Bitcoin traded close to $64,600 on July 26 as traders evaluated weak derivatives activity and a tightly defined technical range. The latest Bitcoin price outlook centered on July 29, when timing models cited by market participants suggested volatility could increase.
The setup drew attention because Bitcoin remained positioned between support near $59,600 and resistance above $66,900. Futures participation was subdued, reducing confirmation for any breakout attempt, while dormant-holder data showed limited selling from older coins. That combination left short-term traders focused mainly on technical levels rather than a broad directional signal.
Bitcoin Holds Near $64,000 as Futures Volume Stays Muted
BTC traded around $64,632 during Sunday’s session. Market data showed an intraday range between $64,193 and $64,829.
A TradingView chart referenced in the source placed Bitcoin above horizontal support near $59,595. The same chart also marked lower support around $57,735, a level associated with Bitcoin’s rebound in June.
Bitcoin remained below nearby resistance at $66,921 and $69,228. The chart identified stronger overhead barriers at $73,128 and $77,546.
That structure kept BTC inside a broad recovery range. Buyers had defended the June lows, but Bitcoin had not yet reclaimed the broken trend structure from May.
CryptoQuant contributor Arab Chain reported that Binance futures volume had a Z-score of minus 1.19. The reading placed activity 1.19 standard deviations below its 12-month average.
Arab Chain said the measure had been weakening since October 2025. Negative readings pointed to subdued participation, not a direct bearish price signal.
That distinction is important because low-volume moves can produce unstable breakouts. A move above resistance would need stronger participation to confirm demand, especially in a market where futures activity can amplify short-term price swings through leverage.
Technical Structure Keeps $58,000 Liquidation Risk in Focus
Trader Killa identified July 29 as Bitcoin’s next timing point. Killa said six of seven comparable periods were followed by negative reactions.
Before that date, the trader outlined two possible scenarios: Bitcoin could sweep recent highs, or it could decline toward the $61,000–$62,000 range.
That view was consistent with Bitcoin’s compressed July market structure. BTC had formed higher lows, but resistance continued to limit follow-through.
Trader DeFiTracer identified more than $2 billion in liquidation liquidity near $58,000. The estimate came from a liquidation heatmap shared Sunday.
Liquidation maps do not forecast direction. They identify price zones where leveraged positions may be forced to close. These levels matter most when price moves quickly into crowded leverage zones, because forced position closures can add to intraday volatility.
A break below $59,595 would expose the $57,735 chart level. Such a move could draw price action toward the reported liquidation cluster.
However, the downside scenario remained unconfirmed while Bitcoin stayed above June support. The market also avoided setting a fresh daily closing low.
Dormant Bitcoin Activity Shows Less Selling From Older Coins
Galaxy Research data showed dormant Bitcoin activity declined sharply during the second quarter. Alex Thorn said movement fell to its lowest level since the third quarter of 2022.
Coin days destroyed also decreased, according to Galaxy’s July 17 research. The metric gives greater weight to older coins when they move.
Thorn linked prior spikes in the metric to profit-taking by long-term holders. He compared that distribution with behavior observed during the 2017 bull market.
Galaxy said 2026 remained on pace for less than half of 2025’s awakened-coin volume. The data indicated that older holders had slowed distribution.
Lower dormant-coin movement can reduce one source of sell-side supply. It does not ensure that demand will strengthen or that prices will rise. On-chain supply metrics are most useful when read alongside exchange flows, spot buying and derivatives positioning, because they show holder behavior rather than immediate market demand.
Crypto Patel reported that wallets holding 100–1,000 Bitcoin had returned to profit. Larger whale cohorts had already moved above their estimated cost bases.
That recovery supported a less defensive on-chain reading. Still, the signal required confirmation from spot demand and trading volume.
Resistance Levels Define Bitcoin’s Next Recovery Test
Trader Ted identified $74,000 as Bitcoin’s first major recovery test. He placed the next resistance near $83,000, around the local peak from May.
The referenced TradingView chart broadly aligned with Ted’s first level. Its marked resistance stood at $73,128, close to the trader’s stated threshold.
A sustained move above that area would improve Bitcoin’s medium-term structure. Failure to clear resistance could keep BTC exposed to another test of lower support.
The near-term Bitcoin outlook therefore depends on two boundaries. Bitcoin needs to hold $59,595 while reclaiming the $66,921–$69,228 resistance band.
July 29 remains the next verifiable timing catalyst from Killa’s model. Traders are expected to monitor volume, daily closes and liquidation pressure around that date, with confirmation still dependent on whether price can leave the current range on stronger participation.

