Bitcoin Outperforms Nasdaq by 42% as Price Tests $82,900 Resistance
Key Takeaways
- •Analyst CrypNuevo has set $82,900 as the key confirmation level for Bitcoin, with a break above it signaling a higher high and $89,300 as the next liquidity target.
- •Bitcoin has outperformed the Nasdaq by roughly 42% over past three months, according to the BTC/Nasdaq ratio.
- •The BTC/Nasdaq ratio declined about 63% from its previous cycle peak, a smaller drawdown than the roughly 84% drop in 2018 and 71% drop in 2022, leading analysts following this pattern to point to $57,800 as a possible macro bottom.
- •Bitcoin now trades above its 50-week simple moving average near $78,800, and analysts note that a weekly close above this level would strengthen the case for a cycle bottom.
- •CrypNuevo's liquidation map tracks approximately $17 billion in long liquidations below the current price, representing medium risk of a long squeeze and keeping short-term pullback scenarios open.
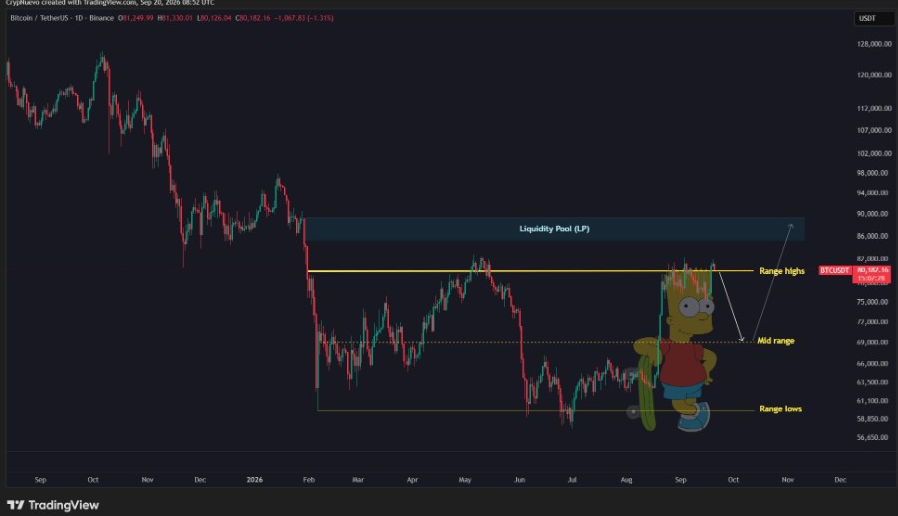
Bitcoin held above $81,000 after recovering sharply from its Sept. 15 low, with CoinGecko placing the price near $81,144. The move leaves the cryptocurrency close to September resistance in the $82,000–$83,000 area and has pushed it back above its 50-week moving-average zone. Analysts are now watching $82,900 for confirmation of another higher high, while liquidation data keeps short-term downside risk in play.
$82,900 Emerges as the Key Resistance
Bitcoin is holding around $80,000 after recovering from the $75,500 area, and recent attempts at the range highs have met selling between $80,000 and $81,000. Analyst CrypNuevo places the next confirmation level at $82,900, saying a break and acceptance above that price would create a higher high on the short-term structure. A higher high — a peak above the prior swing high on a given timeframe — is a standard reference point traders use to judge whether an uptrend structure remains intact.
If Bitcoin clears $82,900, CrypNuevo identifies $89,300 as the next liquidity target. The current setup still allows for a pullback before any breakout, however. Price has repeatedly returned to the $80,000 region after strong intraday moves, keeping the market focused on confirmation rather than a single push through resistance. The four-hour structure also places a recent local low near $75,500, below the current trading range.
Bitcoin Outperforms Nasdaq by 42%
Bitcoin has outperformed the Nasdaq by roughly 42% over the past three months, according to the BTC/Nasdaq ratio, which measures bitcoin's relative strength against the technology-heavy stock index and offers a read on how the asset is performing versus traditional risk markets. The ratio has rebounded from its 2026 low after falling about 63% from the previous cycle peak. By comparison, earlier cycle declines reached approximately 84% in 2018 and 71% in 2022.
The same comparison places the 2026 ratio bottom above the lows of previous cycles on a percentage basis, and analysts using that pattern point to $57,800 as a possible macro bottom for Bitcoin. That level marked the lower boundary of Bitcoin's 2026 decline before price recovered toward $80,000. The current move has also pushed the BTC/Nasdaq ratio back above its recent base.
Previous ratio recoveries have followed deep cycle drawdowns, although the size and timing of each recovery have differed.
Weekly Close Puts the 50-Week Moving Average in Focus
Bitcoin now trades above the 50-week simple moving average near $78,800, while the weekly 50-period exponential moving average sits near $77,500. The 50-week average is a long-cycle trend gauge that many market participants track to separate bullish and bearish phases, which is why closes around it tend to draw outsized attention. Analyst TedPillows says a weekly close above the 50-week moving average would strengthen the case for a cycle bottom. CryptoGoos notes that Bitcoin has not closed a week above that level since the bear market began.
Price has reclaimed the moving-average zone after a fast rebound from the low-$60,000 area, moving back through $77,000 and returning to the $80,000 region within several weekly candles. Bitcoin's bull-market support band sits lower, near $70,200 to $72,500, with both levels now below the market price. A weekly close above the 50-week average would leave Bitcoin above both weekly trend measures in the current setup, making the end of the current weekly candle the next scheduled checkpoint for these levels.
Liquidation Levels Keep Pullback Risk Open
Short-term liquidity data adds a second layer to the outlook. Liquidation levels mark the prices at which exchanges force-close leveraged positions after a move against them, and clusters of these levels beneath the market show where leveraged longs would be unwound in a decline. CrypNuevo reports a medium risk of a long squeeze, with the largest liquidation concentrations sitting below the current price. His liquidation map tracks about $17 billion in long liquidations under its maximum-liquidity setting, and he describes risk above $25 billion as high.
Bitcoin has failed several times near the same local resistance zone despite printing high-volume green candles. CrypNuevo says those candles may reflect short-position building rather than direct buying pressure. His short-term retracement scenario targets part of the recent vertical advance before another bounce develops. Repeated volume spikes near prior local highs also keep the $80,000 area at the center of near-term trading.
The broader range places the mid-range near $69,000 and the range lows around $59,000 to $60,000. A separate liquidity pool sits above price in the upper $80,000 area.
This article is for purposes only and does not constitute financial or investment advice. Cryptocurrency investments involve risk, and past performance does not guarantee future results. Readers should conduct their own research before making investment decisions.
Source: The Market Periodical

