Bitcoin Price Faces $84,000 Test as Analyst Eyes $93,000 Rebound
Key Takeaways
- •Bitcoin dropped below $83,000 on October 14 after September's U.S. CPI report showed a 3.7% annual inflation increase, up from 3.4% in August.
- •Analyst Ali Martinez set $84,000 as the first recovery threshold on the four-hour chart, with the ascending channel midpoint near $88,000 and the upper boundary around $93,000.
- •Buyers repeatedly failed to push Bitcoin through $84,000, and the price traded near $81,800 after briefly touching $83,900.
- •Analyst Ted pointed out that Bitcoin remains above its 50-week EMA, 50-week SMA, and the bull market support band, and said holding above $80,000 is key to extending gains toward $90,000.
- •Gasoline prices rose 9.1%, accounting for more than half of the monthly CPI increase, while core inflation rose 0.3% for the month and 2.6% year over year.
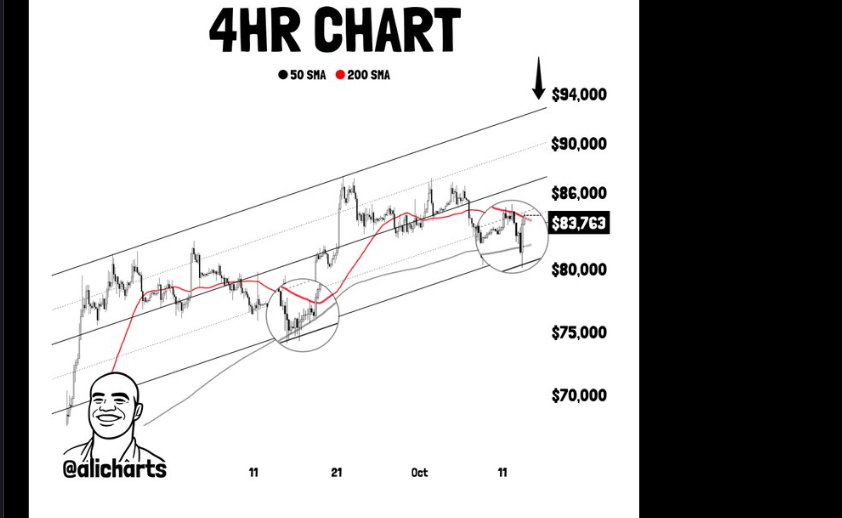
Bitcoin price fell below $83,000 on October 14 after a stronger-than-expected U.S. inflation report, while analyst Ali Martinez outlined a possible recovery within an ascending channel on the four-hour chart. His setup places the channel midpoint near $88,000 and the upper boundary around $93,000. The inflation figures, due on October 14, gave Bitcoin traders fresh data to assess Federal Reserve rate policy. CPI is among the primary inflation gauges the Federal Reserve weighs when setting interest rates, which is why its monthly releases draw close attention from traders across financial markets, including crypto.
First Test Near $84,000
Bitcoin traded near $81,800 after briefly touching $83,900. Buyers failed to push BTC through $84,000, with recovery attempts repeatedly limited. The four-hour chart also shows several swings between the rising channel boundaries since late August.
Martinez identified $84,000 as an early threshold for any stronger recovery. In a post on X, he pointed to the 50-period moving average near that level and compared the latest formation with an earlier bounce from channel support (@alicharts on X). Moving averages like the 50-period average smooth price action over a fixed number of candles and are commonly used by traders to mark trend direction and nearby resistance. During that previous advance, Bitcoin held its 200-period average and moved above the shorter average.
Following September's CPI release, BTC dropped to approximately $82,700, taking the market farther from the first resistance level. According to Martinez, a four-hour close above $84,000 would improve the setup, while another rejection would leave the breakout unconfirmed (@alicharts on X).
$88,000 Midpoint Separates Bitcoin From $93,000 Target
The analyst's charts show Bitcoin trading within an ascending channel, with price moving between the lower support and upper resistance lines. An ascending channel is bounded by two rising parallel trendlines, with the midpoint often serving as an intermediate pivot that traders monitor before the outer boundary. BTC recently approached the lower half of that range before attempting another rebound. The chart's middle line sits near $88,000, about $4,600 above the $83,400 quote.
A move toward $88,000 would carry Bitcoin through nearby resistance between $85,000 and $86,000. Buyers face the channel's midpoint, where a recovery could pause. A sustained move above the middle line would bring the upper boundary near $93,000 into play.
Weekly Support Levels Hold
Analyst Ted also noted that Bitcoin continues to trade above its 50-week exponential moving average (EMA), its 50-week simple moving average (SMA), and the bull market support band — a long-term trend gauge built from the 20-week simple moving average and the 21-week exponential moving average (@TedPillows on X). Weekly moving averages of this kind are widely watched as gauges of longer-term trend strength. BTC has also maintained its position above the May highs, suggesting that buyers to defend key technical levels.
His chart showed Bitcoin trading near $83,600, with the 50-week EMA positioned around $81,600. According to Ted, holding above $80,000 remains important for sustaining the current recovery. He suggested that Bitcoin could extend its upward move toward $90,000 if buyers maintain support above that level. Taken together, the $80,000 weekly support and Martinez's $84,000 four-hour threshold frame the near-term checkpoints traders are watching.
Hot U.S. CPI Data Adds Pressure
The Bureau of Labor Statistics reported a 3.7% annual increase in consumer prices for September, up from 3.4% in August. Monthly inflation reached 0.6%, compared with 0.4% the previous month. Gasoline prices rose 9.1%, accounting for more than half of the monthly CPI increase.
Core inflation, which excludes food and energy, rose 0.3% for the month and 2.6% over the year. The Federal Reserve cites price stability among its mandates, so readings like these feed into expectations for its benchmark rate, which anchors borrowing costs across the economy. The figures arrived after New York Fed President John Williams discussed the possibility of another interest rate increase in 2026. The Federal Reserve raised its benchmark rate by 25 basis points in September. Upcoming inflation prints and Fed communications remain the scheduled inputs for tracking how the rate path develops.
This article is for informational purposes only and does not constitute financial or investment advice.

