Bitcoin Nears $74,500 as ETF Outflows and Wallet Declines Add to Market Pressure
Key Takeaways
- •US spot Bitcoin ETFs saw approximately $2.13 billion in net outflows over the seven sessions ending November 9, including $201 million on November 9 and $213.2 million in redemptions from BlackRock's IBIT.
- •Sunday's sell-off liquidated more than $1 billion in leveraged crypto positions within 24 hours, with Bitcoin accounting for roughly $278 million and long trades bearing most of the forced selling.
- •Santiment reported that Bitcoin's non-empty wallet count dropped by about 108,700 since reaching 59.99 million on October 16, while noting such retail exits have often occurred before major recoveries.
- •Analyst Ted Pillows highlighted that Bitcoin closed a fifth consecutive weekly red candle and lost its 50-week moving average, warning that failure to reclaim it could drive the price down to $70,000.
- •Technically, initial resistance sits near $76,000 and stronger resistance at $80,500-$82,500, while a daily close below $72,000 would weaken the ascending trendline, exposing support at $68,000 and $64,000-$67,000.
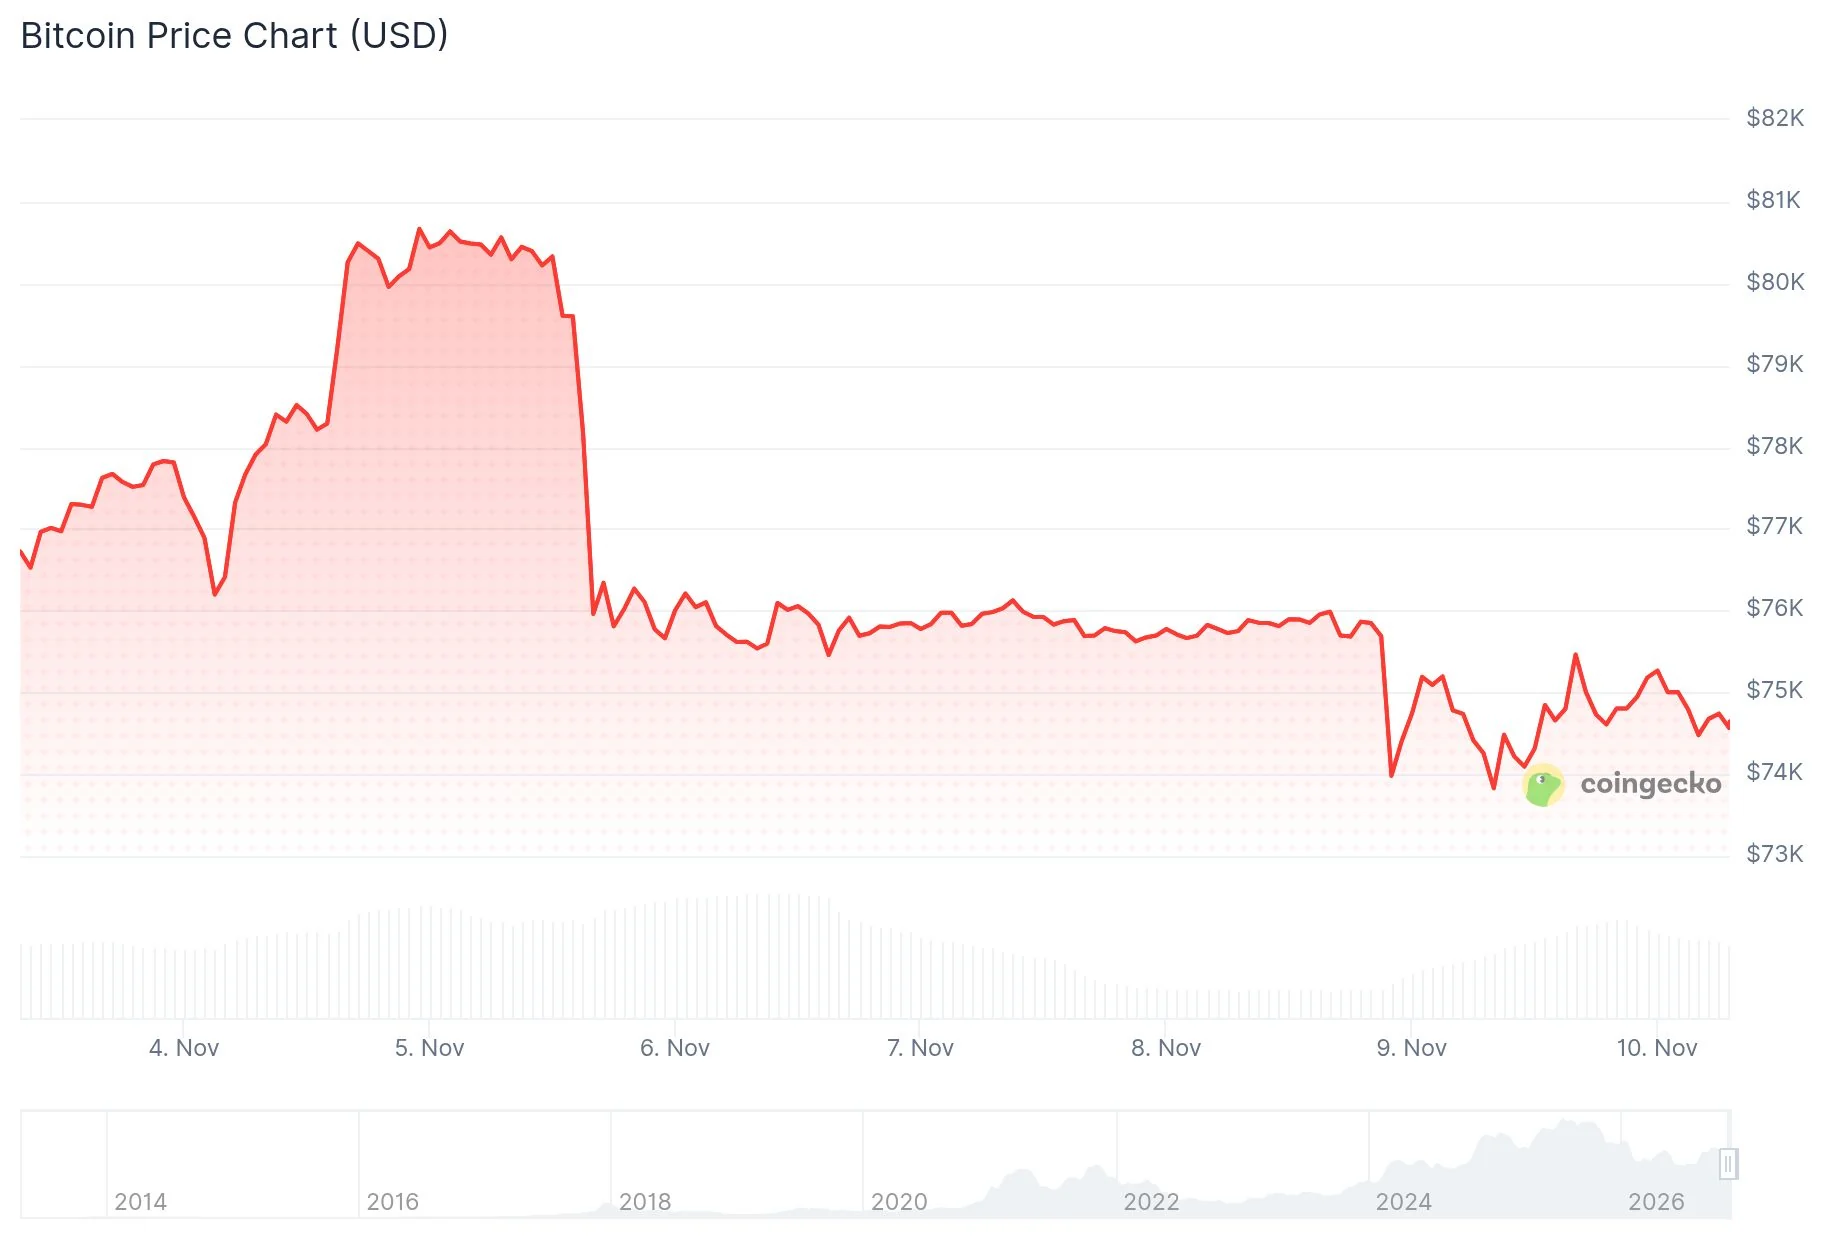
Bitcoin (BTC) was trading near $74,537 on Tuesday, November 10, down 0.93% on the day after several weeks of selling. The cryptocurrency has declined from October highs near $87,000 and is now close to an ascending trendline. ETF withdrawals, leveraged liquidations and an upcoming US inflation report are among the factors shaping the market.
US spot Bitcoin ETFs recorded approximately $2.13 billion in net outflows over the seven sessions ending November 9. During the same period, Santiment reported that Bitcoin had lost about 108,700 non-empty wallets since October 16.
Analyst Ted Pillows said on X that Bitcoin had closed its fifth consecutive weekly red candle and lost its 50-week moving average, a widely watched long-term trend indicator. He said that if BTC does not reclaim the moving average soon, it is highly likely to fall to $70,000.
$BTC closed its 5th consecutive week in red and also lost the 50W MA. If Bitcoin doesn't reclaim the 50W MA soon, it's highly likely BTC will drop to $70,000. pic.twitter.com/LwcGSkXQoc — Ted (@TedPillows) November 9, 2026
The October US Consumer Price Index report was scheduled for release at 8:30 a.m. Eastern Time on November 10. The data could influence expectations for Federal Reserve interest rates, while higher inflation could reduce expectations for rate cuts.
Liquidations and ETF outflows
Sunday’s sell-off liquidated more than $1 billion in leveraged crypto positions over 24 hours, according to CoinCentral. Bitcoin positions accounted for approximately $278 million of that total. Liquidations occur when exchanges automatically close leveraged trades after losses exhaust posted margin, and long trades representing most of the liquidations meant bets on rising prices bore the brunt of the forced selling. BTC briefly fell toward $73,700 before recovering.
US spot Bitcoin ETFs, which hold bitcoin directly and trade on stock exchanges, posted $201 million in net outflows on November 9, according to Farside Investors: Their daily flows are widely followed as a read on institutional demand for bitcoin. It was the third consecutive day of withdrawals. BlackRock’s IBIT recorded $213.2 million in redemptions, partly offset by inflows into other funds.
ETF outflows totaled $411.9 million on November 6 and $430.2 million on November 5. Across the seven sessions ending November 9, withdrawals reached approximately $2.13 billion. Despite the recent outflows, cumulative ETF inflows since the products began trading in January 2024 remain above $55 billion.
Wallet count and on-chain data
Santiment Intelligence said Bitcoin’s number of non-empty wallets reached 59.99 million on October 16, just below 60 million. Non-empty wallets, which count only addresses holding a positive balance, are used by analysts as a gauge of holder participation. Since then, the count has declined by roughly 108,700 wallets as BTC fell back below $75,000.
🚨 Bitcoin Loses 109K Wallets As Retail is Giving Up! 😰 Bitcoin reached 59.99M non-empty wallets on October 16th, somehow just coming up shy of the round 60M number. Since then, that total has fallen by roughly 108.7K wallets as BTC's price has now dropped back below $75K and… pic.twitter.com/Dy4o66ibUb — Santiment Intelligence (@SantimentData) November 10, 2026
Santiment said smaller holders appeared to be growing impatient. However, the firm noted that a declining wallet count does not necessarily indicate weaker network use, since smaller traders may consolidate or empty wallets during prolonged declines.
The analytics firm added that retail exits of this type have often occurred before major recoveries. It said the signal would appear stronger if BTC held the $74,000–$75,000 range while the wallet count continued to decline. Santiment also placed exchange supply — the balance of coins held on trading platforms — near 1.28 million BTC and said a move back to $78,000–$80,000 would support the view that selling pressure was weakening.
Glassnode’s November 9 report showed that daily active addresses increased 1.8% to approximately 670,600. Entity-adjusted transfer volume reached $5.7 billion, while monthly realised capital growth slowed to 0.49%. The share of supply in profit, which tracks the portion of coins last moved at prices below spot, fell to 60.6%, and short-term holders were near break-even.
Bitcoin price levels
On the daily chart, Bitcoin was rejected near $85,000–$87,000 in early October. The ascending trendline extending from June’s $57,000 low was around $72,000–$73,000. Tuesday’s intraday low was $74,238.
Initial resistance was near $76,000, followed by $78,000. A stronger resistance zone stood between $80,500 and $82,500. A daily close below $72,000 would weaken the trendline, with subsequent support at $68,000 and within the $64,000–$67,000 range.
Bitcoin’s Relative Strength Index, a momentum gauge read on a scale of 0 to 100, was 36.14. The MACD line stood at -1,733, below its signal line at -1,411, producing a histogram reading of -322.

