Bitcoin Tests Key $80,000 Support as US Spot ETFs Shed $82.39 Million and CPI Hits 3.7%
Key Takeaways
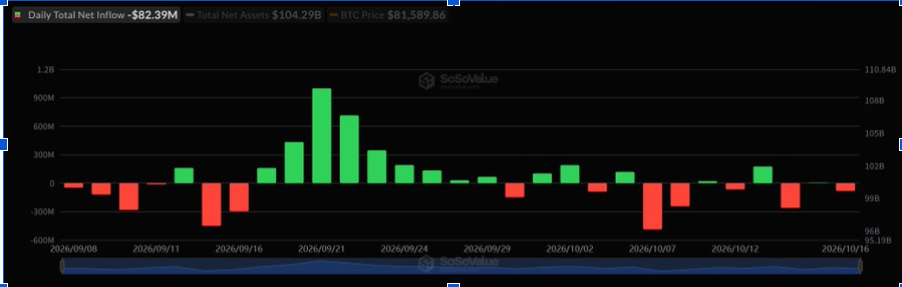
- •U.S. spot Bitcoin ETFs recorded $82.39 million in net withdrawals on October 16, with BlackRock's IBIT and Fidelity's FBTC accounting for the outflows.
- •Bitcoin traded near $81,000 on October 18 as traders monitored the key $80,000 support level and the 50-week moving average near $81,362.
- •U.S. spot Ethereum ETFs lost $69.68 million on October 16, marking a third consecutive day of withdrawals.
- •Analyst Michaël van de Poppe said tightening price action reflects declining volatility and warned a false breakout could occur before Bitcoin establishes a clear direction.
- •U.S. annual inflation reached 3.7% in September, and Strait of Hormuz shipping security concerns added pressure to broader markets.
Bitcoin traded near $81,000 on October 18, touching the $81,200 area at points, as traders watched the key $80,000 support level following a session in which U.S. spot Bitcoin ETFs logged $82.39 million in net withdrawals. BlackRock and Fidelity products accounted for the reported outflows, and the decline in institutional fund flows coincided with Bitcoin's struggle to recover from a recent drop below $80,000. Traders continued to monitor nearby moving averages and resistance levels, while rising U.S. inflation and shipping security concerns around the Strait of Hormuz added broader pressure to markets.
Bitcoin ETFs Record $82.39 Million in Daily Outflows
U.S. spot Bitcoin ETFs reported combined net outflows of $82.39 million on October 16, according to SoSoValue data. BlackRock's iShares Bitcoin Trust (IBIT) accounted for $71.78 million of the total, while Fidelity's Wise Origin Bitcoin Fund (FBTC) recorded $10.61 million in withdrawals. The remaining funds reported no net flows that day.
Because spot ETFs hold Bitcoin directly on behalf of traditional investors, SoSoValue's daily flow reports are widely used as a same-day gauge of institutional demand. The figures marked another reversal after the products attracted $5.06 million on October 15. Earlier in the week, the funds recorded $175.7 million in inflows on October 13, followed by approximately $261.4 million in outflows on October 14. The swings showed how daily investor demand fluctuated while Bitcoin traded near a closely watched price range.
Ethereum funds also reported withdrawals on October 16. U.S. spot Ethereum ETFs lost $69.68 million, with BlackRock's ETHA accounting for the day's net outflows. The session marked a third consecutive day of withdrawals for Ethereum investment products.
Bitcoin Tests Its 50-Week Moving Average
Bitcoin traded around $81,803 at the time of writing, following a week that included a brief move below $80,000 and a rebound above that level. The cryptocurrency had earlier reached prices above $84,000 before buyers failed to the advance, and the subsequent pullback brought attention back to support near $81,000.
A BTC/USDT daily chart places the moving average near $81,362. Analyst Mister Crypto identified the line as Bitcoin's 50-week moving average and, in a post on X, pointed to a possible rebound if buyers defend that area. The chart shows the yellow average rising into a horizontal support zone extending from approximately $80,000 to $82,000.
Longer-term moving averages such as the 50-week line are widely tracked because they smooth out short-term price noise and are commonly used to judge whether a broader trend remains intact. Recent candles have narrowed near the moving average after Bitcoin fell from the $86,000 area. Several sessions show small price changes and repeated attempts to remain above the line. The setup therefore identifies a level under test rather than confirming whether support will hold.
Analyst Outlook Focuses on Support and Resistance
Bitcoin continues to trade within a narrow range as buyers struggle to push the price above nearby resistance levels. Crypto analyst Michaël van de Poppe noted in an X post that the tightening price action reflects declining volatility, which could precede a larger market move. However, the analyst expects a possible false breakout before Bitcoin establishes a clear direction.
His chart places BTC near $81,780, with immediate resistance around $82,000. Van de Poppe identified a potential buying area below $80,000, marked by a blue support zone on his chart. Bitcoin has already tested this region once, and the analyst believes another decline into the area remains possible. The chart also identifies support near $80,140, while a deeper pullback could bring the $77,380 level into focus.
On the upside, the analysis points to a possible rally toward $90,000 if BTC breaks above the crucial $82,000 resistance. Additional resistance sits near $82,600, followed by $84,150 and $85,270 — levels buyers would need to overcome to maintain an upward move.
Inflation and Hormuz Tensions Add Market Pressure
U.S. annual inflation, as measured by the Consumer Price Index, reached 3.7% in September. The reading followed rising energy costs and increased market expectations for further Federal Reserve tightening. Higher borrowing costs remain a consideration for investors evaluating risk assets, including cryptocurrencies.
Shipping security around the Strait of Hormuz, one of the world's most important transit routes for global oil supplies, also remained in focus. U.S. Central Command chief Admiral Brad Cooper said roughly 400 commercial vessels crossed the waterway over seven days despite attacks on shipping, and that U.S. measures had prevented at least $25 billion in Iranian crude exports. Continued disruptions could affect oil prices and inflation, leaving Bitcoin traders monitoring economic releases alongside ETF demand and the $80,000 support level.
This article is for informational purposes only and does not constitute financial or investment advice. Cryptocurrency markets involve significant volatility and potential capital losses. Readers should conduct independent research and consult a qualified financial adviser before making investment decisions.
This article is based on reporting by The Market Periodical, published October 19, 2026.

