Bitcoin (BTC) Holds Above $80K as US Spot ETFs Draw $286 Million in Two Days
Key Takeaways
- •Bitcoin rose 1% to 1.6% to trade near $80,800 on Oct. 28, staying below the $82,000 level as investors positioned for the Federal Reserve's rate decision.
- •U.S. spot Bitcoin ETFs attracted roughly $286 million in net inflows over two days, led by BlackRock's IBIT with $151.5 million on Tuesday.
- •On-chain data from Santiment recorded a net outflow of about 14,942 BTC from exchanges, the largest single-day outflow in five weeks.
- •Spot Ether ETFs moved in the opposite direction, posting about $149 million in outflows over Monday and Tuesday and $1.32 billion for October.
- •Analysts identified $81,400 as a key resistance level on a three-day closing basis, with support at $80,000, $78,000, and $76,000 if prices weaken.
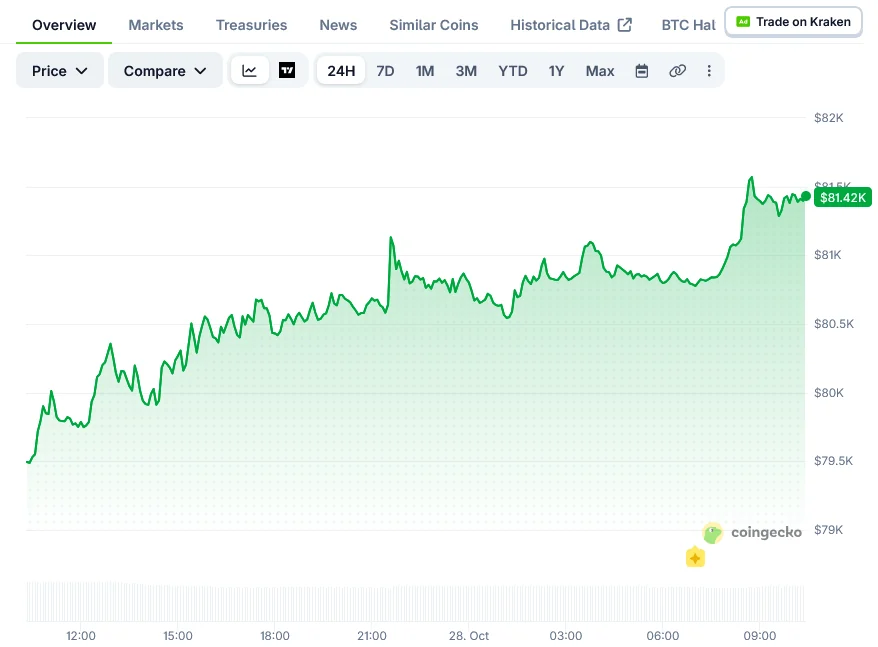
Bitcoin (BTC) traded near $80,800 on Oct. 28, gaining between 1% and 1.6% over the past 24 hours as markets positioned for the Federal Reserve's interest rate decision scheduled for later in the day. The asset moved within a range of $79,416 to $81,159 over the session, with trading volume near $23.5 billion and market capitalization holding above $1.62 trillion.
Despite the advance, Bitcoin has not reclaimed the $82,000 level. Traders are monitoring exchange flows and spot ETF demand alongside reports of possible U.S. military action against Iran.
Spot Bitcoin ETFs Post Two Days of Inflows
U.S. spot Bitcoin exchange-traded funds took in roughly $176 million on Tuesday, according to SoSoValue data, with BlackRock's IBIT leading the day at $151.5 million. That followed about $110 million in net inflows on Monday, bringing the two-day total to $286 million. Flows through these funds, which began trading in January 2024, are widely tracked as a gauge of institutional demand for bitcoin.
The bid marks a turnaround after a difficult stretch: the funds shed nearly $774 million combined on Thursday and Friday of last week. October's net outflows have since narrowed to approximately $26 million, while year-to-date net inflows stand at roughly $850 million.
Spot Ether ETFs moved in the opposite direction, recording about $149 million in net outflows across Monday and Tuesday. Their cumulative October outflows have reached $1.32 billion.
On-chain data from Santiment showed approximately 14,942 BTC leaving exchanges on a net basis, the largest single-day outflow in five weeks. Santiment suggested the withdrawals could point to reduced selling pressure ahead of the Fed meeting, though it noted that exchange transfers can also reflect custody changes or movements between platforms.
Sentiment gauges improved modestly. The Crypto Fear & Greed Index rose to 51 from 48, remaining in “Neutral” territory. A week earlier, the index read 63, a level classified as “Greed.”
Fed Decision in Focus
Markets broadly expect the Federal Reserve to hold its target range at 3.75% to 4.00% following September's quarter-point increase. Attention will center on Chair Kevin Warsh's comments on inflation and the outlook for December. Rate decisions are closely watched across digital-asset markets because they shape dollar liquidity and appetite for risk assets.
Adding to macro uncertainty, a Wall Street Journal report said U.S. officials warned Gulf countries about a possible short military campaign against Iran after the Nov. 3 midterm elections. No final decision has been announced, but the report raised concerns about oil prices and inflation. Oil prices feed into inflation readings, which sit at the center of the Fed's policy calculus.
Analysts Track Key Levels
CryptoQuant research head Julio Moreno said Bitcoin's spot demand kept shrinking in October, with the firm's Bull Score Index falling from 90 to 60. Moreno identified the 365-day moving average at $77,585, the trader realized price, the average price at which bitcoin last moved on-chain, at $74,041, and the 200-day moving average at $73,028 as levels to watch if prices weaken.
Analyst Ali Martinez highlighted Bitcoin's historical weakness in fourth quarters following U.S. midterm election years, citing negative Q4 returns in 2014, 2018 and 2022. He shared the observation in an X post on Oct. 26:
Q4 2026 COULD BE PAINFUL FOR BITCOIN
Bitcoin's Q4 performance during recent U.S. midterm election years has been particularly interesting:
• 2014: -16.70%
• 2018: -42.16%
• 2022: -14.75%$BTC has now posted a negative Q4 in each of the last three midterm election years. If… pic.twitter.com/LZu1OvuTBk
— Ali Charts (@alicharts) October 26, 2026
On the daily chart, Bitcoin sits below its nine-day moving average of $81,416 and its 21-day moving average of $81,905. The Relative Strength Index, a momentum indicator, reads 45.52, below the neutral 50 threshold.
Analyst Rekt Capital identified $81,400 as a key level on a three-day closing basis. Reclaiming it could open a test of $82,000 to $82,500, while immediate support sits at $80,000, followed by $78,000 and $76,000.

