Bitcoin Correction Risk Grows After $15K Two-Day Surge Stalls Near $80,000
Key Takeaways
- •Bitcoin rose to $79,463 on Friday before slipping back below $78,000, leaving a sharp weekly gain of 24.27%.
- •One large wallet sold 7,700 BTC worth $576.6 million over three days, adding supply near the upper end of the move.
- •US spot Bitcoin ETFs took in $606.3 million on Thursday and about $1.61 billion for the week, supporting demand.
- •Bitcoin’s four-hour RSI reached 87 and the Money Flow Index hit 100, both indicating heavily overbought conditions.
- •The $75,000 to $76,000 range is the initial support area, while a move above $80,000 would weaken the correction case.
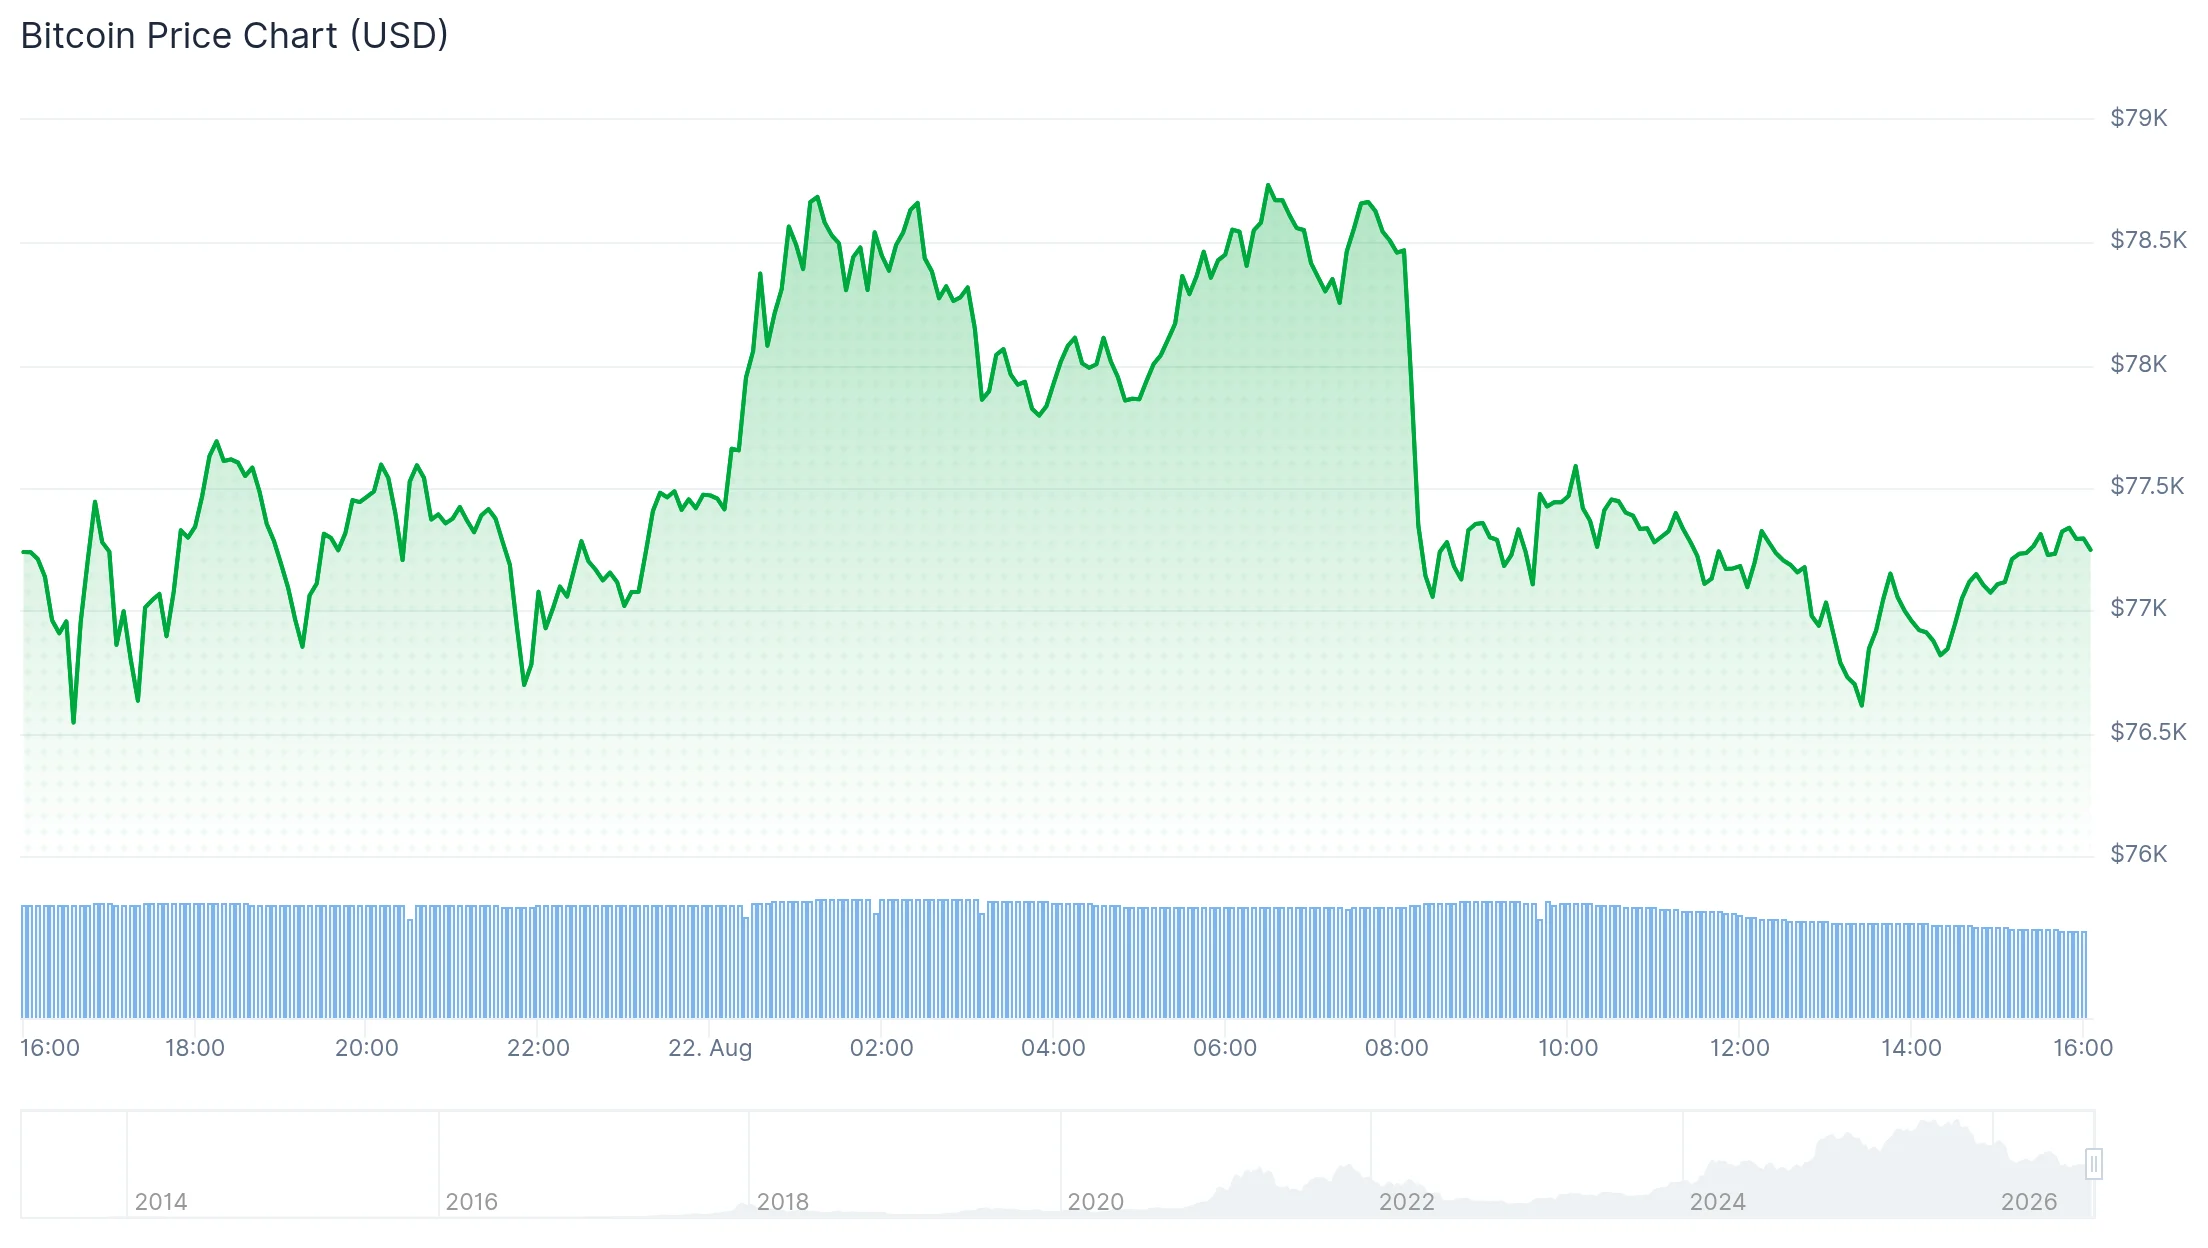
Bitcoin has flashed signs of exhaustion after a rapid surge carried it close to $80,000. The move added more than $15,000 in 48 hours before sellers rejected the breakout, and BTC now trades near $77,325, with an intraday range between $76,400 and $78,763. The pullback has raised Bitcoin price correction concerns after one of the strongest weekly advances since 2024.
The rally still has support from spot exchange-traded fund inflows and changing US liquidity expectations. Yet several pressure points stand out. Whale selling has added supply near resistance, led by a single address that disposed of 7,700 BTC worth $576.6 million in three days. The four-hour RSI reached historically stretched short-term levels, while the Crypto Fear and Greed Index jumped from 34 last week to 71 today. The $75,000 to $76,000 zone provides initial support, and stronger ETF inflows could offset sales from large Bitcoin holders. Together, these signals place the $80,000 resistance and nearby support levels under closer scrutiny.
Bitcoin Price Correction Risk Builds Below the $80,000 Level
The rejection followed a sharp advance from the mid-$60,000 area. Bitcoin reached $79,463 on Friday, its highest price since May, before losing the $78,000 level. TradingView shows a 24.27% weekly gain, a result that leaves late buyers exposed if momentum weakens.
Bitcoin whale selling increased while the rally approached major resistance. On-chain analytics firm Lookonchain tracked one unidentified address selling another 2,700 BTC for about $211.8 million on Saturday. The same wallet sold 7,700 BTC worth $576.6 million across three days.
Insane! This mysterious whale sold another 2,700 $BTC ($211.8M).
In just the past 3 days, the whale has sold 7,700 $BTC ($576.6M). pic.twitter.com/xCJm7ScH0F
— Lookonchain (@lookonchain), August 22, 2026
A separate wallet ending in bc1qqt sold 550 BTC for $39.43 million, a transaction that locked in an estimated $4.5 million profit. These sales do not confirm that a Bitcoin price correction has started. Instead, they add supply near a major resistance zone after a fast repricing.
Bitcoin whale selling can pressure thin order books, particularly after forced short covering helped accelerate the rally. More than $4.3 billion in crypto shorts were liquidated from Wednesday through Friday. Liquidations are mechanical rather than discretionary: when rising prices erase a short seller's collateral, the exchange closes the position automatically, and each forced buy-back can trigger the next, which is why liquidation spikes of this size tend to coincide with outsized, fast rallies. That mechanical buying fades once exchanges finish closing leveraged bearish positions, removing a source of demand that helped fuel the vertical move.
Spot demand offers a counterweight. United States Bitcoin ETFs attracted $606.3 million on Thursday and about $1.61 billion during the week, inflows that show institutions participated in the rebound. Since the SEC approved spot Bitcoin ETFs in January 2024, these funds have given institutions a way to hold BTC exposure in ordinary brokerage accounts without custoding coins directly, and their daily creation and redemption figures now function as a real-time demand gauge for the broader market. The US Treasury also plans to double long-dated bond buybacks to at least $4 billion per operation, and lower yields paired with a weaker dollar have improved demand for scarce assets.
Sustained ETF inflows could absorb whale supply, while slower demand would increase Bitcoin price correction risk below $76,000. Bitcoin must hold the $75,000 to $76,000 breakout zone to prevent sellers from gaining short-term control, and the variables to watch from here are the ones this rally has already surfaced: the size of daily ETF flow prints, whether the large wallets flagged by on-chain data continue to distribute, and how price behaves at that breakout zone.
Whale Selling and Bitcoin RSI Now Test Rally Strength
Momentum gauges present a second warning. Bitcoin's four-hour RSI reached its highest recorded level during Friday's move toward $79,700. The reading placed the RSI at 87 and the Money Flow Index at 100, both deep in overbought territory.
Bitcoin RSI measures the speed and size of price changes, and traders often treat readings above 70 as overbought. Bitcoin price correction signals can fail during strong trends, and strong trends can keep RSI elevated while prices continue rising.
Sentiment has changed just as quickly. The Crypto Fear and Greed Index stands at 71, classified as greed. The index aggregates volatility, market momentum, social-media activity and investor polling into a single 0-to-100 score, which is why it is read as a crowd-psychology gauge rather than a trading signal. It registered 72 yesterday, compared with 34 and fear one week ago. The 37-point weekly swing shows how rapidly caution turned into enthusiasm. Rising greed can bring demand, but it also leaves the market sensitive to disappointing flows, and buyers who entered near $80,000 may sell quickly if Bitcoin loses the recent breakout.
Initial support sits around $75,000 to $76,000, while the broader $70,000 to $72,000 area would become important during a deeper retreat. A break above $80,000 would weaken the Bitcoin price correction case, although it would also require enough spot demand to absorb continued profit-taking. Failure at that level keeps a lower high possible on short timeframes.
Jim Cramer added a social-media talking point after recommending Bitcoin instead of Bitmine stock. Traders often joke about taking the opposite side of his calls, but the "inverse Cramer" meme is not a market indicator, and Cramer's remark provides no measurable evidence about price direction, support, volume, or liquidity.
Source: Blockonomi

