Bitcoin Price Prediction as Wall Street Buying Frenzy Continues
Key Takeaways
- •Bitcoin traded around $79,800, consolidating below resistance near $82,793 in a pattern technical analysts view as a potential bullish flag requiring an upside breakout for confirmation.
- •Spot Bitcoin ETFs added more than $770 million in the first five days of the month, including $730 million on Thursday led by BlackRock's IBIT and over $174 million on Friday.
- •A daily close above the $82,793 resistance could target $90,000, while losing support near $75,700 would weaken the bullish setup, with a drop below roughly $71,800 further damaging the recovery.
- •U.S. jobs data showed over 160,000 jobs created last month with an upward revision to July, and with inflation above the Fed's 2% target, a rate hike to 3.75%-4% is possible, weighing on risk assets.
- •The Crypto Fear and Greed Index entered the greed zone at 75, and weakness in equities such as the Kospi, Micron, SanDisk, and Seagate has likely driven investor rotation back into Bitcoin.
Key Insights
Bitcoin price has remained within a tight range over the past few days.
Spot Bitcoin ETF inflows have continued to accelerate.
The coin has formed a bullish flag pattern on the daily chart.
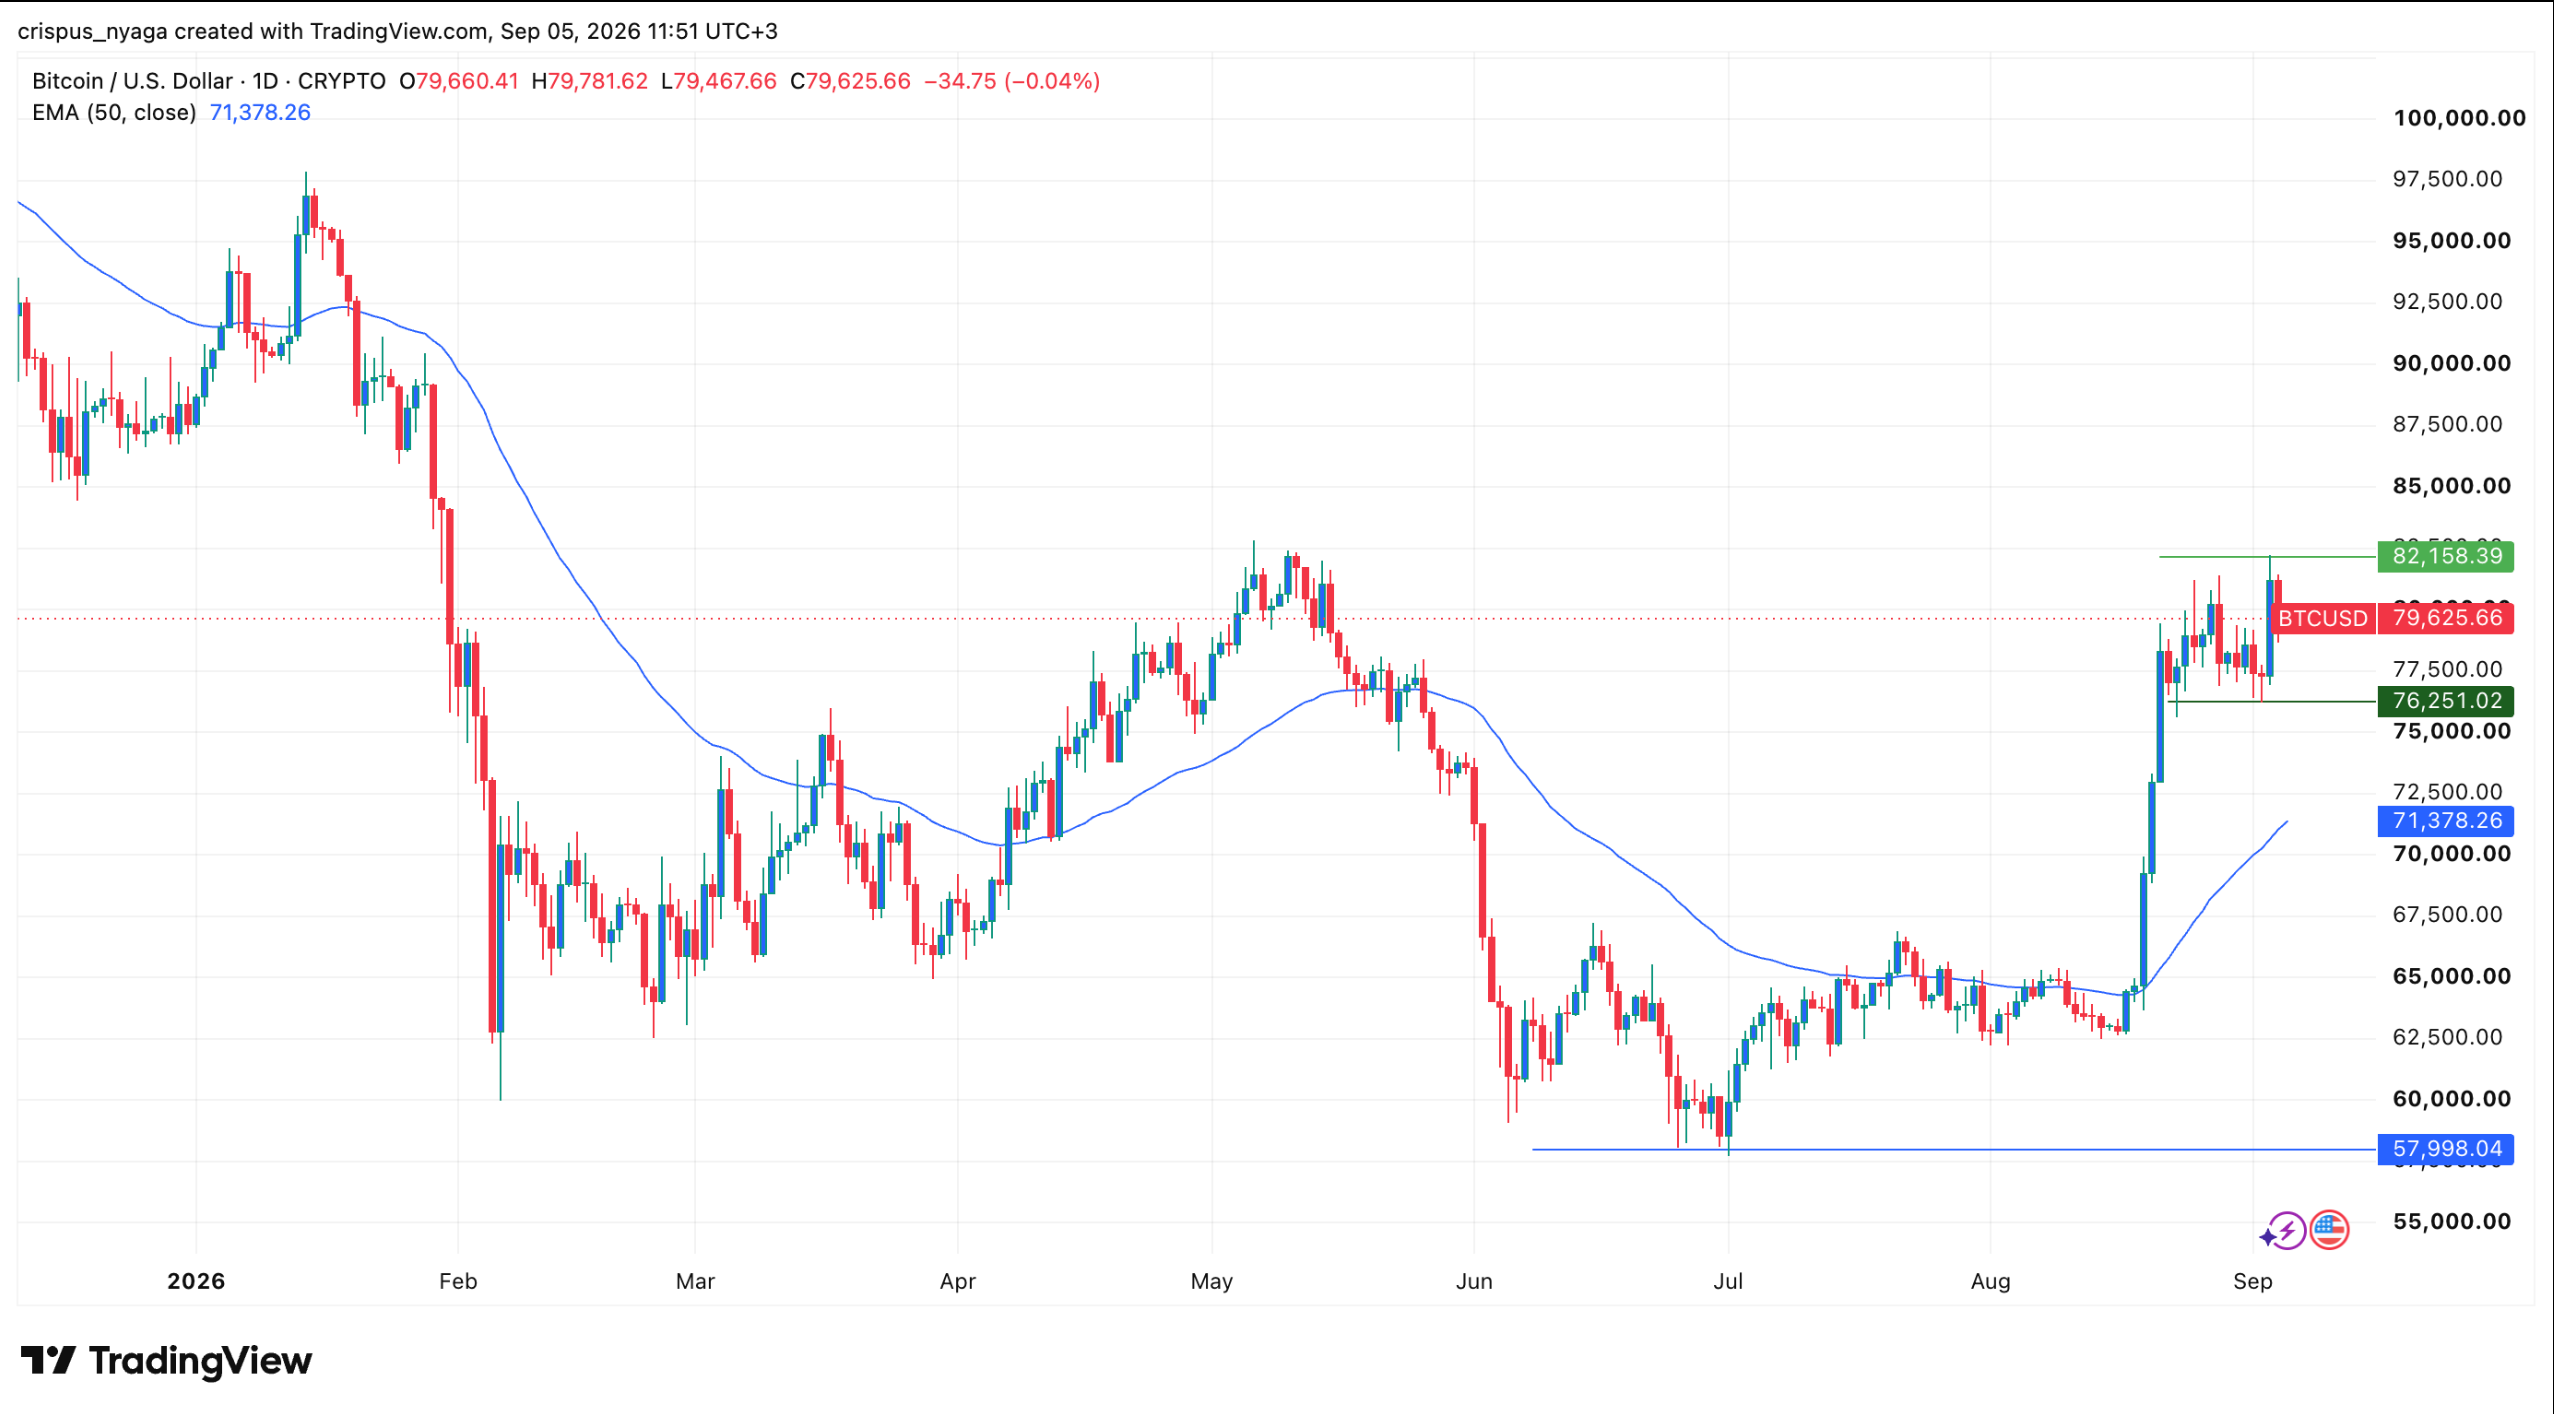
Bitcoin price held near $79,800 after strong U.S. jobs data revived expectations of a rate hike. The cryptocurrency stayed below resistance after reaching roughly $82,160 earlier this month.
CoinMarketCap showed BTC trading around $79,800 at publication. The price remained well above its July low near $57,900.
Bitcoin Price Holds Bull Flag Below $82,800 Resistance
Bitcoin continued consolidating following its sharp recovery from the July lows. The supplied TradingView chart showed the price moving inside a narrow range beneath recent highs.
The structure resembles a bullish flag following the earlier advance — a pattern in which price drifts sideways or slightly lower after a strong rally, often interpreted by technical analysts as a pause before a continuation of the prior trend. However, the pattern still requires an upside breakout before it can be confirmed.
Reuters technical analysis identified resistance near $82,793. That area also aligns with Bitcoin’s May high and a Fibonacci retracement level, a tool traders use to identify potential turning points based on ratios between price swings.
A daily close above that resistance could bring $90,000 into focus. Continued strength above $90,000 would put the $100,000 psychological level back on traders’ radar.
The bullish setup would weaken if Bitcoin lost support near $75,700. A deeper decline below roughly $71,800 would further damage the recovery structure.
Momentum indicators on the supplied TradingView chart have also moved higher. That said, rising oscillators alone do not confirm an imminent breakout.
BTC Price Jumps as ETF Inflows Accelerate
The ongoing Bitcoin price action has attracted buyers from American institutional and retail investors. Spot Bitcoin ETFs — exchange-traded funds that hold actual BTC and trade on U.S. stock exchanges, giving investors Bitcoin exposure through conventional brokerage accounts — have been a major conduit for this demand since their approval in January 2024. Data shows that these funds added more than $174 million in assets on Friday this week. A day earlier, these funds — led by BlackRock’s IBIT — took in $730 million.
Spot Bitcoin ETFs have added over $770 million in the first five days of the month. If this pace accelerates, the funds may surpass the $3.52 billion added in August this year.
This buying by Wall Street traders signals that they expect the token’s price to rebound, particularly now that the stock market has become highly volatile. In South Korea, for instance, the Kospi Index has dropped nearly 30% from its year-to-date high. That is notable because South Korean stocks were among the top drivers of the AI bull run earlier this year.
Top AI stocks in the U.S. have also pulled back from their 2026 peaks. Micron, SanDisk, and Seagate all remain down by double digits from their highest levels. This price action has likely prompted investors to rotate back into Bitcoin and other altcoins.
Bitcoin has also performed well as a sense of greed returns to the market. The Crypto Fear and Greed Index, a widely watched gauge that blends volatility, momentum, social media, and survey data into a single sentiment score, has jumped into the greed zone at 75. In most cases, Bitcoin tends to do well when greed dominates the market.
The Federal Reserve Is a Major Wild Card
Still, the ongoing Bitcoin price rally faces a major headwind from the Federal Reserve, which may raise interest rates in the coming months. Higher rates typically weigh on risk assets like Bitcoin because they raise the return on safe holdings such as Treasury bonds and tighten financial conditions, reducing appetite for speculative positions. Data released on Friday showed that the economy created over 160,000 jobs last month. The Bureau of Labor Statistics (BLS) also revised the July jobs report upward.
These numbers, combined with the fact that inflation remains above the Federal Reserve’s 2% target, mean that the central bank has an incentive to hike. By doing so, the Fed would bring the rate to between 3.75% and 4%. Bitcoin and other risky assets tend to underperform when the Fed is hiking rates. This explains why Bitcoin and top indices such as the Dow Jones and the S&P 500 slipped after Friday’s jobs report.
This article is for informational purposes only and does not constitute financial advice. Cryptocurrency and equity markets can experience sharp price movements.
