Bitcoin Price Holds Near $64,500 as Analysts Debate the Next Cycle Bottom
Key Takeaways
- •Bitcoin recovered to about $64,500 on Nov. 17 after a weekend drop to roughly $62,000, with analysts identifying $60,000 as the key nearby support level.
- •Nicolas Chéron linked the renewed selling pressure to weaker stock markets and declining demand for riskier assets, outlining a possible trading range between $60,000 and $85,000 if prices stabilize.
- •Four-year cycle frameworks from Crypto Patel and Whale Scan point to a potential bear market in 2026, with Patel's model depicting a possible 75% decline from the 2025 peak after Bitcoin's record of $126,199 set in October 2025.
- •The Supply in Profit indicator is approaching a rising support line previously tested around 2015, 2019, 2020, and 2022, which CryptoGoos described as a possible bottom signal that has not been confirmed as a reversal.
- •A chart shared by @cryptorover showed Bitcoin testing its 50-month moving average with a Fear and Greed Index reading of 10, alongside a projection of a possible 2026 low and a new peak around 2030.
Bitcoin traded near $64,500 on Nov. 17 after recovering from a weekend low around $62,000, a pullback that has renewed debate over the asset's four-year market cycle and the possibility of further losses. Analysts identified $60,000 as a nearby downside reference, while historical cycle comparisons and Bitcoin's Supply in Profit indicator offered conflicting interpretations of market conditions. Neither measure confirmed that Bitcoin had reached a lasting bottom, with attention focused on whether the $60,000 level holds.
Recovery Weakens Above $60,000
A two-week BTC/USD chart placed the asset at $64,493, showing a candle low of $62,026 and a 13.68% decline from that candle's opening price. The rebound from the weekend low has so far left Bitcoin hovering above the $60,000 level that analysts have flagged as major support.
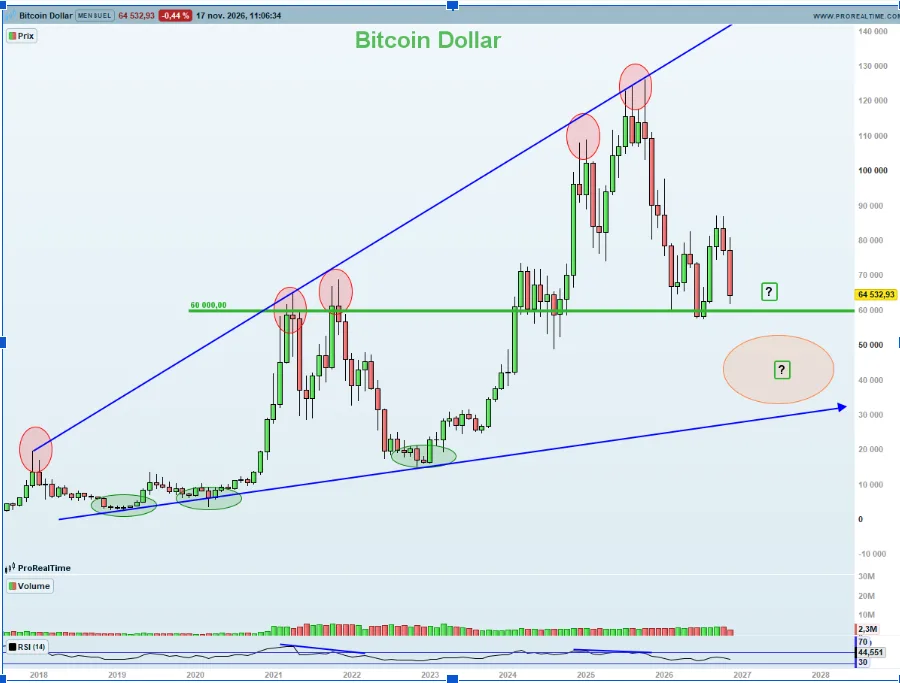
On a separate monthly chart, market analyst Nicolas Chéron marked $60,000 as a major support level and noted that Bitcoin's July recovery from that area proved short-lived. Chéron linked the renewed selling pressure to weaker stock markets and falling demand for riskier assets. If prices stabilize, he outlined a possible trading range between $60,000 and $85,000, while his chart also identified a lower region near $40,000 and a rising support line beneath previous cycle lows — areas that represent chart scenarios rather than confirmed destinations.
Four-Year Cycle Framework Points to a 2026 Bear Market
The four-year cycle is a framework many analysts use to frame Bitcoin's history of multi-year advances and drawdowns, a rhythm often associated in market commentary with the halving events that reduce the rate of new coin issuance roughly every four years. Analyst Crypto Patel compared Bitcoin's cycle peaks in 2017, 2021, and 2025, estimating roughly 1,420 days between major tops and placing another possible peak in 2029. He also examined earlier accumulation periods between two long-term exponential moving averages, with his chart marking declines of about 84% following the 2017 top and 79% after the 2021 peak. The framework depicts a possible 75% fall from the 2025 peak.
Whale Scan presented a similar four-year sequence, assigning 2023 to buying, 2024 to holding, 2025 to selling, and 2026 to a bear market. The account cited a Bitcoin record of $126,199 set in October 2025, and its next cycle places buying in 2027 with a possible selling year in 2029.
Supply in Profit Returns to Historical Support
Analyst CryptoGoos focused on Bitcoin's Supply in Profit indicator, which measures the proportion of circulating coins carrying unrealized gains. That share generally shrinks when market prices fall below more holders' acquisition levels. His analysis showed the indicator approaching a rising support line associated with previous market downturns, with earlier tests recorded around 2015, 2019, 2020, and 2022, alongside a new test in 2026.
CryptoGoos cited subsequent advances of 12,193%, 2,129%, and 719% after selected past signals, although those historical gains do not predict returns in the current cycle. The indicator measures holder profitability rather than the amount buyers intend to purchase at a particular price, and a support test can occur before a market reaches its final low. He described the latest reading as a possible bottom signal but did not establish a confirmed reversal.
Longer-Term Charts Leave Room for Further Losses
Another chart shared on X by the account @cryptorover identified a test of Bitcoin's 50-month moving average — a long-term trend indicator that averages roughly four years of monthly closing prices — and displayed a Fear and Greed Index reading of 10, near the fear end of its 0-to-100 sentiment scale, with market bottoms marked in 2015, 2019, and 2022. Its extended projection showed a possible 2026 low, a new peak around 2030, and another decline by 2032.
For the nearer term, Chéron's $60,000 level provides a clear reference below the current market. His proposed $85,000 range ceiling would require a substantial recovery, while the lower chart area remains a downside scenario.
Bitcoin has recovered from its latest move near $62,000, but the analyses do not establish that selling has ended. The next test centers on whether buyers can continue defending the $60,000 region as market participants compare current conditions with earlier cycles.
This article provides market analysis, not investment advice. Historical patterns and technical indicators do not reliably predict future returns. Bitcoin remains volatile, and investors can lose their capital.
Source: The Market Periodical

