Bitcoin Holds $75,278-$76,825 Range as Traders Watch Fed and ETF Flows
Key Takeaways
- •Bitcoin traded at $76,358.12 on September 17, rising 0.66% in 24 hours while lagging the broader cryptocurrency market's 1.13% gain.
- •The Federal Reserve's 25-basis-point rate hike on September 16 raised the target range to 3.75%-4.00% and ended its pause without a hawkish surprise, helping ease selling pressure.
- •Bitcoin liquidations fell 66.46% to $76.73 million over 24 hours while open interest was nearly unchanged, indicating recent volatility has cleared overleveraged positions and calmed the market.
- •U.S. spot Bitcoin ETFs recorded approximately $746 million in combined outflows on September 15 and 16, including $450 million on the first day, keeping fund flows a key test of traditional finance demand.
- •A daily close above $76,825 would point to improving momentum, while a break below the $75,278 Fibonacci support could drive Bitcoin toward $74,000, leaving the market in neutral consolidation until a decisive move.
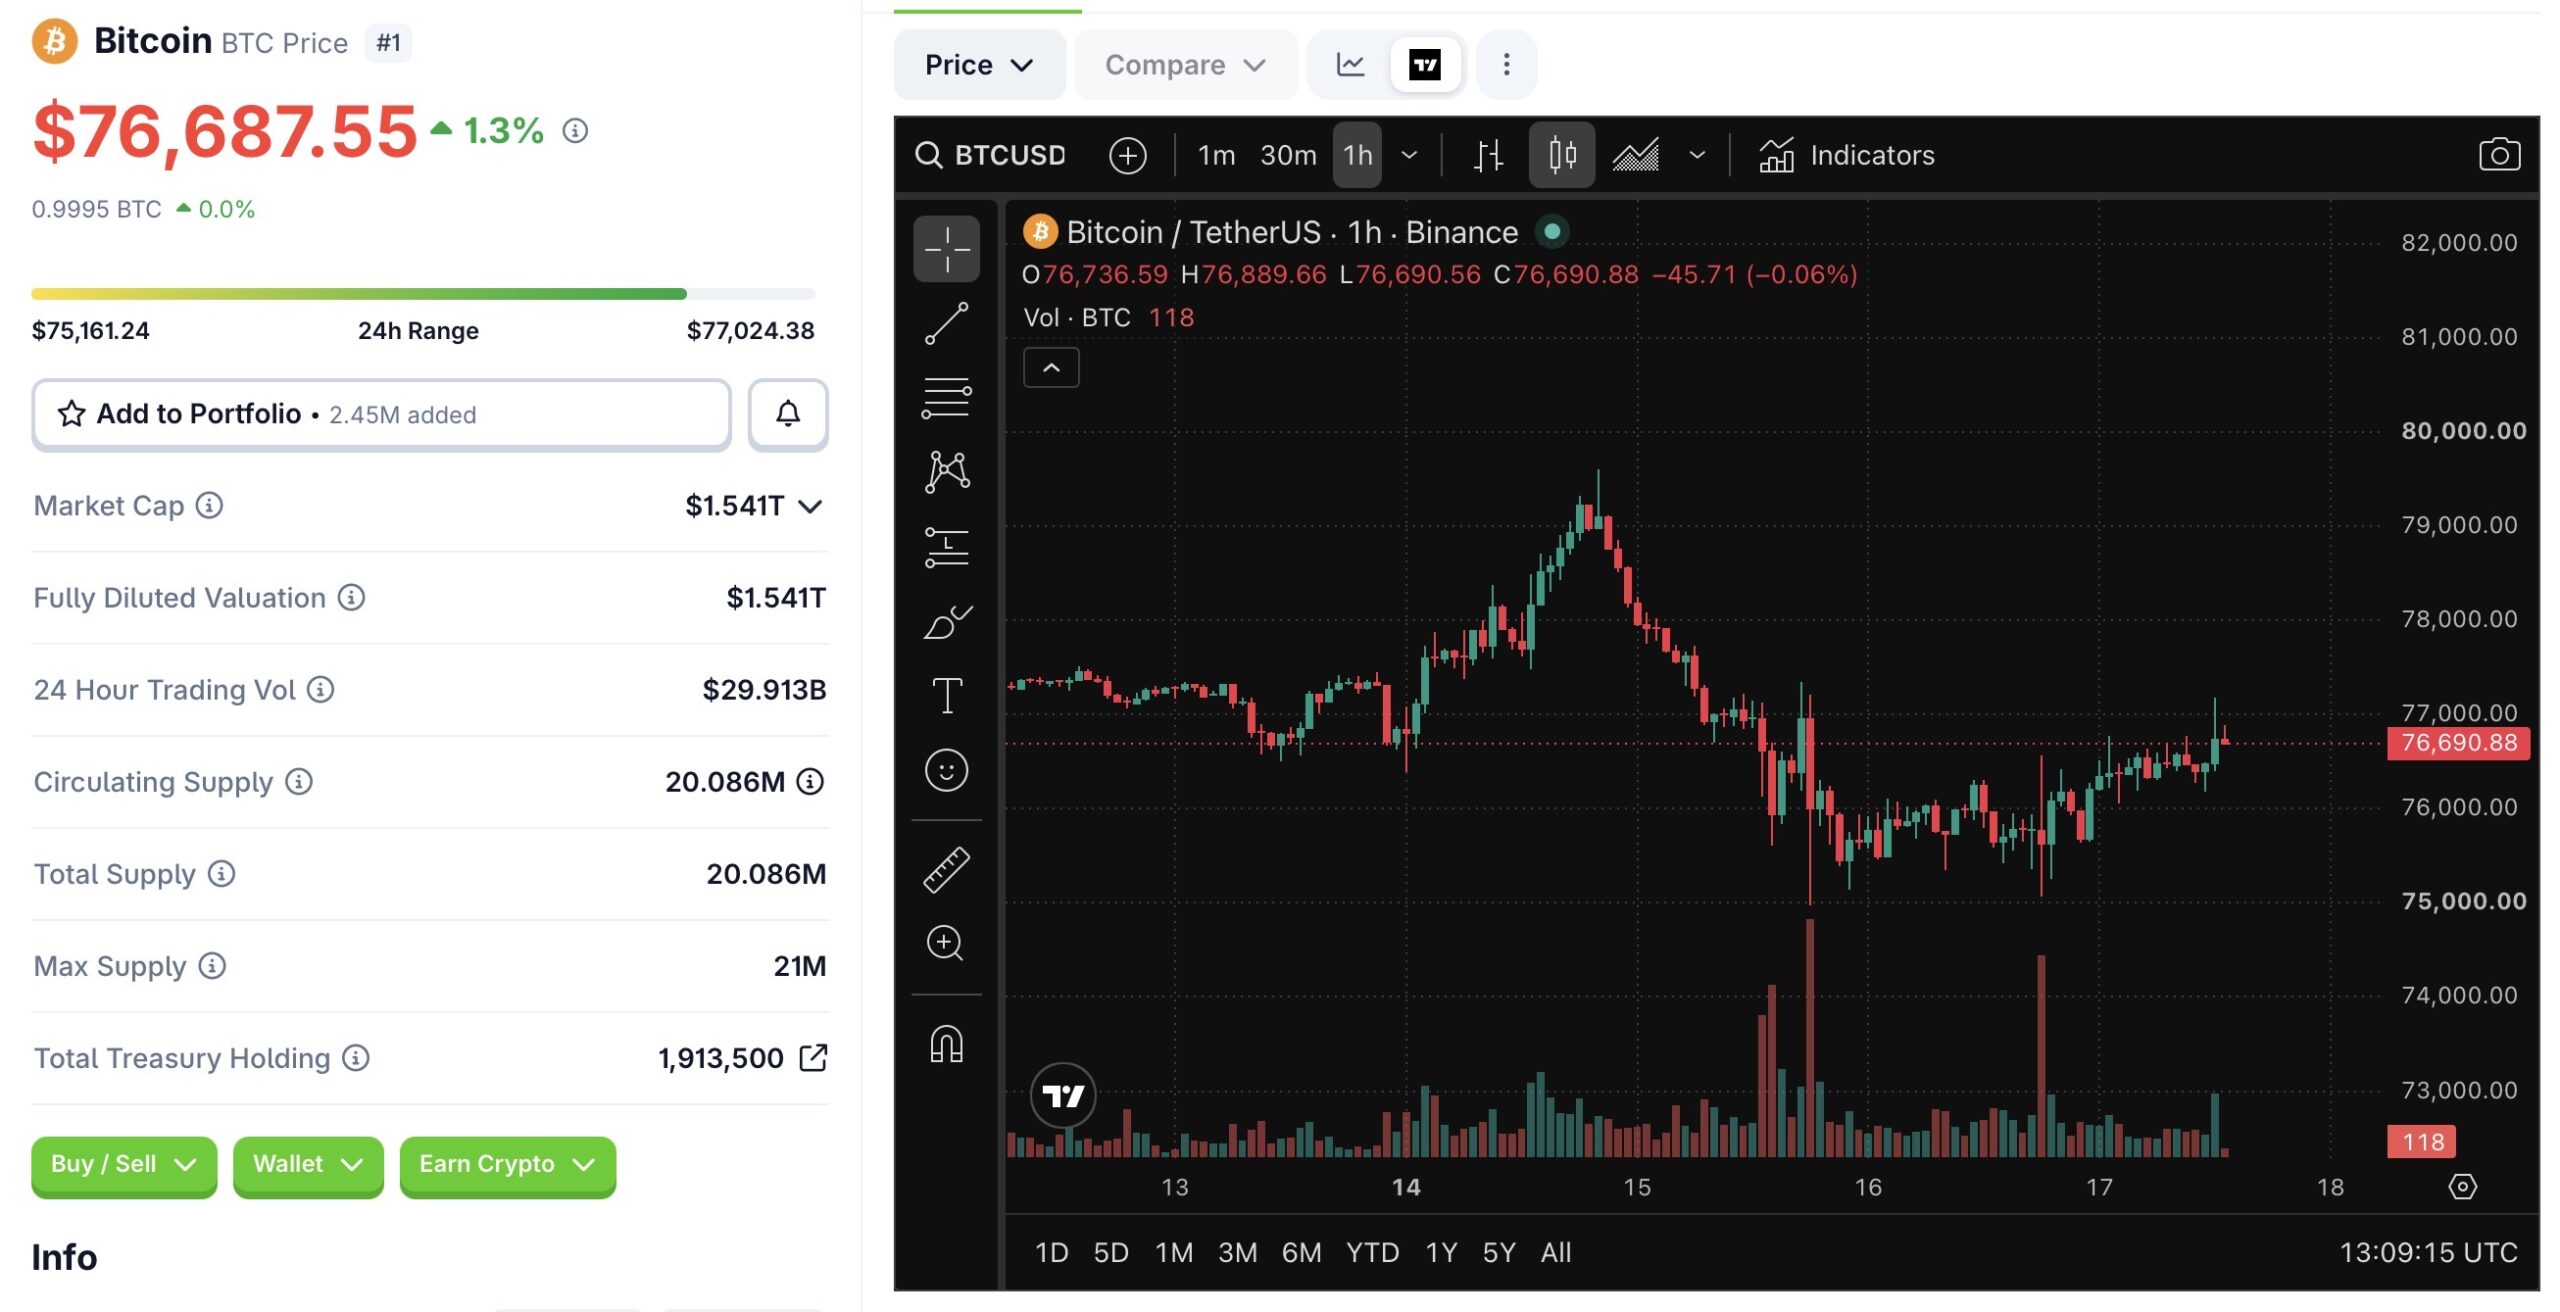
Bitcoin is trading within a narrow range bounded by $75,278 support and $76,825 resistance. The $75,278 Fibonacci level is the key support in the current setup: holding above it could leave room for a retest of $76,825, while a break below could shift attention toward $74,000. Fibonacci retracement levels, derived from mathematical ratios that technical analysts use to map potential reversal zones, are among the most widely referenced tools for framing support and resistance.
Bitcoin traded at $76,358.12 on September 17, up 0.66% over 24 hours. The broader cryptocurrency market gained 1.13% during the same period, leaving Bitcoin slightly behind the wider market move. The advance was attributed in part to the Federal Reserve’s expected 25-basis-point rate hike on September 16, which arrived without a hawkish surprise and eased some selling pressure.
“BREAKING: The Federal Reserve officially hikes interest rates by 25 basis points, marking its first rate hike since July 2023. This ends the longest Fed interest rate pause since 2008. — The Kobeissi Letter (@KobeissiLetter) September 16, 2026”
$75,278 Support and $76,825 Resistance
Bitcoin’s chart structure remains neutral, with the price between 38.2% Fibonacci support at $75,278 and resistance near the seven-day simple moving average at $76,825. The relatively narrow range indicates that the market has yet to establish a clear direction.
A daily close above $76,825 would be a technical sign of improving momentum and could support a retest of higher levels. In contrast, a move below $75,278 would renew bearish pressure and place $74,000 in focus. Trading volume is down 22.5%, pointing to limited conviction behind either a sustained advance or a decisive breakdown.
Open Interest and Liquidations
“$BTC Refuses to go down with Open Interest staying elevated mostly from shorts trying to force it lower. Sign of strength imo. pic.twitter.com/lag1cx1cSd — exitpump (@exitpumpBTC) September 17, 2026”
Derivatives data points to a calmer market rather than a strong directional move. Total open interest was nearly unchanged, declining 0.49%, while Bitcoin liquidations fell 66.46% to $76.73 million over 24 hours. Open interest tracks the total value of outstanding derivative contracts, and liquidations occur when exchanges forcibly close leveraged positions that have moved against traders, which is why sharp drops in liquidations often follow stretches of elevated volatility. The data indicates that recent volatility has reduced overleveraged positions that could otherwise have amplified price swings.
Lower liquidation pressure may provide a more stable base for price action, but it does not independently confirm renewed demand. U.S. spot Bitcoin exchange-traded fund flows remain an important market signal after spot Bitcoin ETFs recorded a $450 million outflow on September 15. Across September 15 and 16, the ETFs lost about $746 million. Because spot Bitcoin ETFs hold bitcoin directly and trade through conventional brokerage accounts, their daily flows are widely read as a barometer of demand from traditional finance investors.
Key Levels for Bitcoin’s Next Move
The bullish case remains conditional rather than confirmed. A daily close above $76,825 would suggest that Bitcoin is regaining momentum after its recent consolidation, while ETF flows remain a key test.
The bearish case is defined by the range’s lower boundary. A break below $75,278 could push Bitcoin toward $74,000. Macroeconomic pressure remains a risk after the Federal Reserve raised interest rates by 25 basis points on September 16, bringing the target range to 3.75%-4.00%.
Bitcoin briefly rose to $76,499.99 after the decision but surrendered the gain within half an hour. Its correlation of roughly -0.46 with the S&P 500 also highlights the role of broader macroeconomic conditions.
For now, the $75,278-$76,825 range remains the central framework for the market. Traders are watching Japan’s September 18 rate decision for the next potential signal, a policy announcement tracked worldwide given the historical sensitivity of global risk assets to Japanese monetary policy. Until Bitcoin closes decisively beyond either boundary, the setup remains one of neutral consolidation.
Source: https://icobench.com/news/bitcoin-price-analysis-key-levels/

