Bitcoin Price Risks a Drop Toward $72,500 as Three-Week Selloff Deepens
Key Takeaways
- •Bitcoin logged its third consecutive weekly loss and briefly fell to $79,631 on Monday before recovering above $80,000, with $80,400 acting as nearby resistance.
- •U.S. spot Bitcoin ETFs drew $528.40 million in inflows on Oct. 21 before recording more than $635 million in withdrawals on Thursday.
- •Glassnode data showed corporate treasury holders with an average purchase price of $80,200 and active investors near $77,600, making the $80,000 area a significant cost-basis zone.
- •Analyst Ali Martinez identified $82,000 as resistance and projected a possible decline toward $72,500, while analyst Ted reported more than $80 million in bids between $78,000 and $79,000.
- •The Federal Reserve's interest rate decision on Oct. 28, followed by U.S. inflation and third-quarter GDP figures on Oct. 29, is the week's most closely watched macro event.
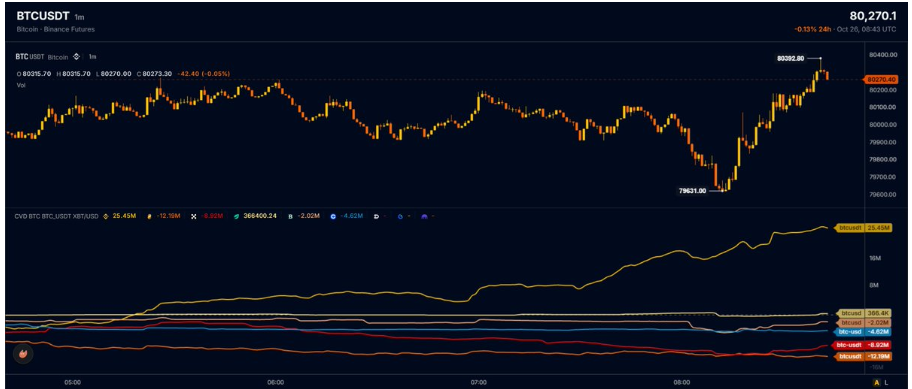
Bitcoin traded near $80,000 on Monday, Oct. 26, after logging its third consecutive weekly loss, with selling pressure persisting even as buyers stepped in around the psychological support level.
Analysts identified competing liquidity concentrations near $79,000 and $82,000, while Glassnode data pointed to weakening spot demand as traders prepared for the Federal Reserve's interest rate decision. The analyst Ted (post on X) reported more than $80 million in bids between $78,000 and $79,000, while fellow analyst Ali Martinez outlined a potential decline toward $72,500, with $82,000 standing as nearby resistance.
Bitcoin Struggles Near $80,000 After Weekend Selling
Bitcoin had spent the previous two weeks trading between roughly $80,000 and $86,000 without mounting a recovery. The weakness carried into the weekend, and BTC closed with a bearish weekly candle for the third straight week.
The decline followed a difficult week across financial markets, as technology shares fell and rising oil prices raised inflation concerns. Selling pressure intensified on Thursday, when U.S. spot Bitcoin ETFs recorded more than $635 million in withdrawals.
Bitcoin consequently entered Monday under pressure, briefly falling to $79,631 before recovering to an intraday high of $80,392.80. The price later eased toward $80,270 as sellers re-emerged near the $80,400 resistance level.
Ted had warned that spot sellers remained active, though he later reported that dip buyers had returned on Binance. The rebound followed buying around $80,000, where large orders had previously helped support Bitcoin during declines.
On-Chain Data Shows Buyers Returning Near $80,000
The buying interest around $80,000 comes as on-chain data shows several major investor groups holding Bitcoin near that level. Cost-basis levels are a staple of on-chain analysis, as they record the average prices at which large cohorts accumulated their holdings — and with several of those clusters sitting near $80,000, the area carries added significance for market watchers. According to Glassnode's October 21 report, corporate treasury holders had an estimated average purchase price of $80,200. U.S. spot Bitcoin ETFs sat near their cost basis, while active investors carried a lower average cost of approximately $77,600.
Glassnode also found that Binance buy orders near $80,000 had recovered after being filled during the Oct. 15 selloff. Institutional demand, however, has been slow and steady over the past few years within the same price range.
Spot ETF flows, widely followed as a gauge of institutional demand since the funds began trading in the United States in January 2024, have been uneven. According to a recent report on Bitcoin ETF inflows, the funds pulled in $528.40 million on Oct. 21 before withdrawals began on Oct. 22.
That imbalance in demand was evident in Monday's trading, as BTCUSDT cumulative volume delta — a running measure of net buying versus selling pressure — climbed to around 25.45 million during the rally. Several other tracked trading pairs saw declines, though not enough to suggest buying was strong across the board. The Fear and Greed Index, a widely used sentiment gauge, meanwhile stood neutral at 50, indicating a lack of market direction.
Can Bitcoin Break Above $82,000?
The struggle to sustain buying momentum has left analysts watching whether Bitcoin can recover above $82,000 or continue to correct.
Analyst Ali Charts (post on X) reported that BTC had broken a rising parallel channel on the four-hour chart. He identified $82,000 as resistance and projected a possible decline toward $72,500 if selling continued.
"That's where I'll be looking for the next buying opportunity," Ali wrote, referring to the $72,500 level.
Ted identified liquidity concentrations near $81,500 and $79,000, with selling pressure increasing the likelihood that the lower levels are tested first. He reported more than $80 million in bids ranging from $78,000 to $79,000, although those orders remain subject to change.
Bitcoin must first clear $80,400 before challenging the resistance areas around $81,500 and $82,000. A sustained move above those levels could open the way toward $84,000, while losing $79,200 could expose $76,000.
The next market test arrives on Oct. 28, when the Federal Reserve announces its interest rate decision. Rate decisions shape expectations for borrowing costs and liquidity across financial markets, making the announcement the week's most closely watched macro event. U.S. inflation and third-quarter GDP figures are due on Oct. 29, providing traders with further economic data as Bitcoin tests support.
This article provides information, not financial advice. Cryptocurrency investments carry substantial volatility and the potential for losses. Readers should conduct independent research before making investment decisions.
This article originally appeared on The Market Periodical.

